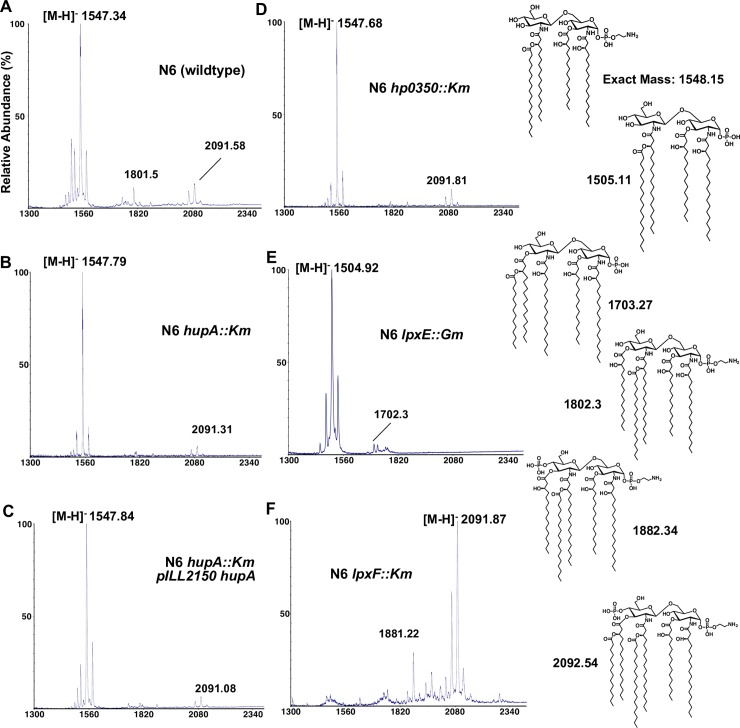
Fig 3. Mass spectrometry analysis of lipid A.
Lipid A was isolated from wild-type (A), hupA (B), hp0350 (D), lpxE (E) and lpxF (F) mutant and complemented cells (C) in strain N6 and analyzed by MALDI-TOF mass spectrometry in the negative-ion mode. The corresponding lipid A structure of the most abundant species is depicted for each analyzed strain.

