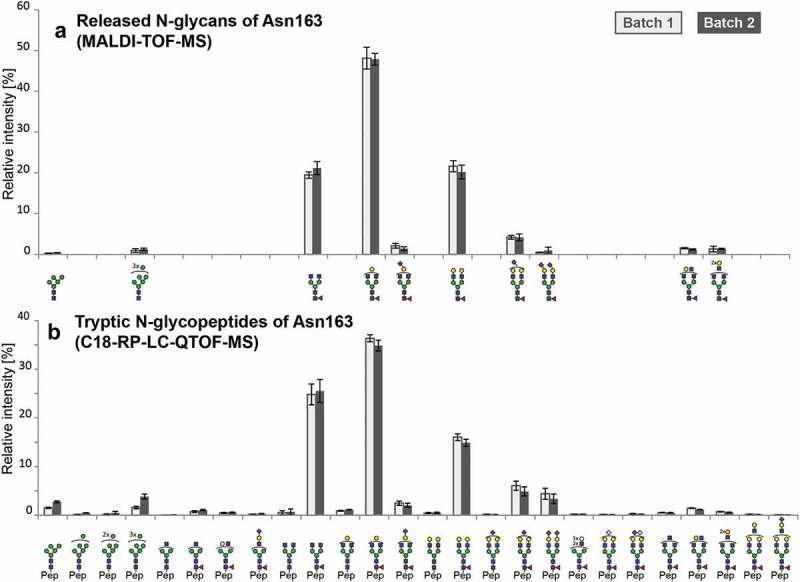
Figure 2.

Relative quantitation of N-glycoforms of atacicept. (a) Released N-glycans were analyzed by MALDI-TOF-MS after linkage-specific sialic acid derivatization. Peak intensities were normalized based on the total intensities of all N-glycans in a sample. Sialic acids (purple diamond) pointing to the right indicate α2,3-linkage. (b) Tryptic N-glycopeptides were analyzed by C18-RP-LC-MS, and peak intensities were normalized on the total peak intensity of all N-glycopeptides in a sample. Standard deviations are shown.
