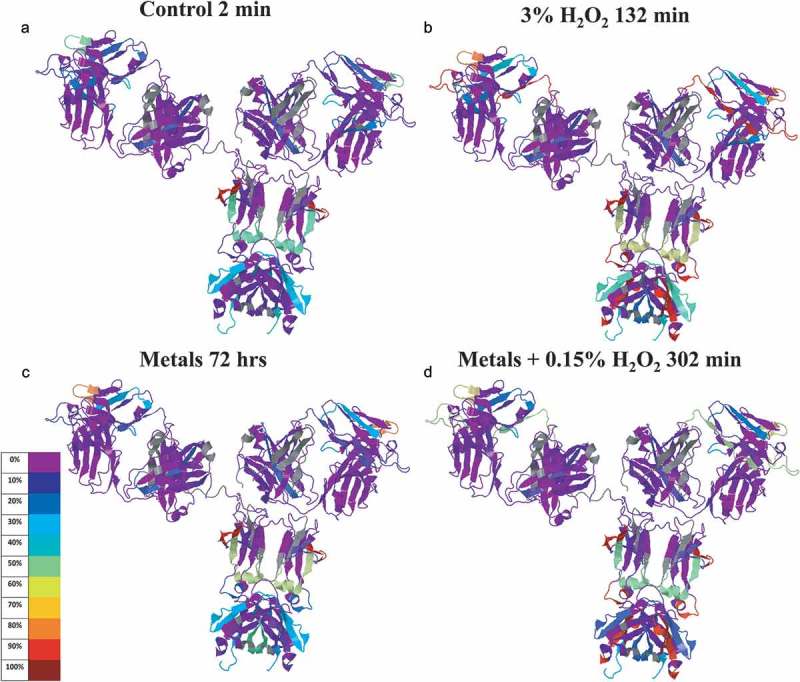
Figure 5.

IgG1 structure with mapped modification levels at initial and ending time points of three stress conditions. Color code represents percentage means calculated from quadruplicated scans (3 DIA + 1 DDA) of triplicated tryptic and chymotryptic digestions. IgG1 was mapped to construct of 1HZH by the Global Characterization Data Processing Site.
