
Figure 7.
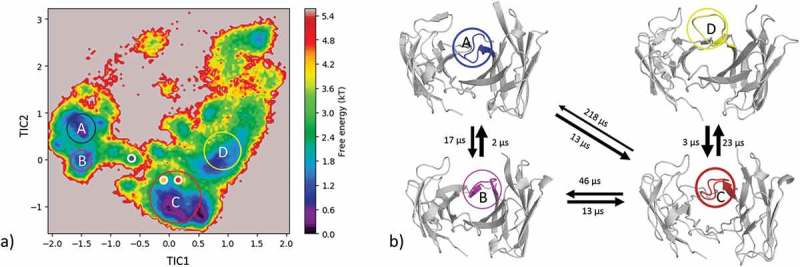
(a) Estimated free energy surface of the CDR-H3 loop based on a tICA including the projected crystal structures. The AGed X-ray structures are colored orange and red, while the AGless X-ray structure is colored in blue. The macrostates are illustrated as circles and were identified with PCCA+ clustering. (b) First mean passage times combined with the representative macrostate structures based on tICA of the CDR-H3 loop. The thickness of the circles represents state probabilities, while the width of the arrows relates to the strongly varying transition timescales.