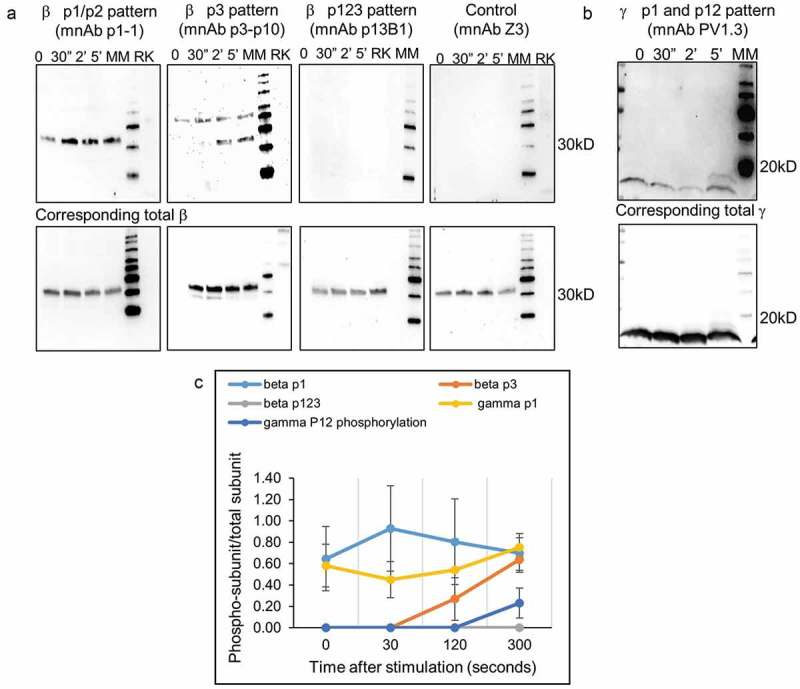
Figure 4.

Phosphorylation pattern analysis of FcϵR1 subunits.
a) Assessment of phosphorylation patterns of β subunits after stimulation with DNP-BSA is shown using three antibodies p1-1, p13B1, and p3p10 utilizing western blotting with antibodies in minibody format. The FcϵR1 receptor was stimulated with 2 nM DNP-BSA and the data show phosphorylation patterns at various time points post stimulation. Phosphorylation at resting (basal) is also given. Antibody Z3 and rat kidney cell lysate (RK) were used as negative controls. The lower panel shows the total β detection used as a loading control. b) Similar analysis performed for anti-γ PV1.3. c) Patterns of phosphorylation graphed with data from multiple experiments (3–8 cell lysates prepared at different times).
