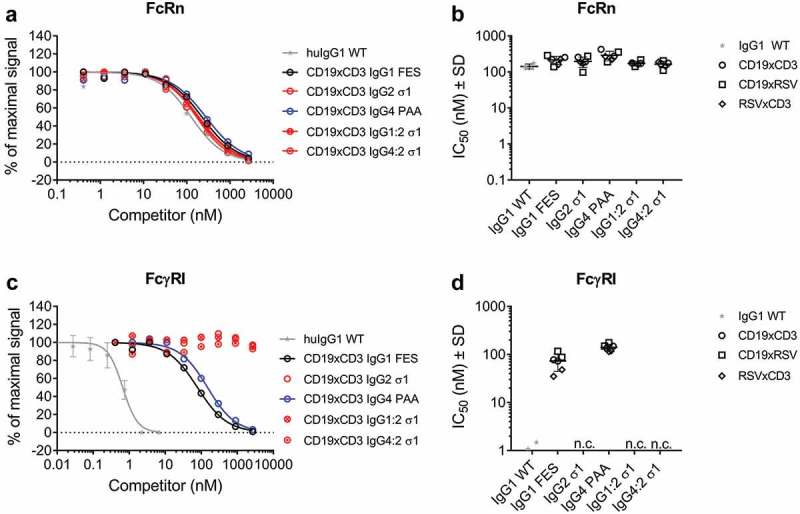
Figure 2.

Binding of model BsAbs of different IgG subclasses to Fc receptors.
The binding to FcRn and FcγRI of was determined by AlphaScreenTM competition assay in comparison to a WT huIgG1 (grey stars). In such assays, a higher IC50 value translates to a weaker binding to the tested FcR. A: Dose-response of FcRn binding. Curves show the competition of CD19xCD3 BsAbs of one representative experiment (single measurement per concentration). The error bars represent the SD of the WT-control which was measured on multiple plates.B: IC50 values of FcRn binding. CD19xCD3 (open circles), CD19xRSV (open squares) and RSVxCD3 (open diamonds) BsAbs were grouped by Fc and individual values are plotted from two independent experiments. Lines represent the mean IC50 ± standard deviation (SD) through all tested molecules per Fc.C: Dose-response of FcγRI binding. Curves show the competition of CD19xCD3 BsAbs of one representative experiment (single measurement per concentration). The error bars represent the SD of the WT-control which was measured on multiple plates.D: IC50 values of FcγRI binding. CD19xCD3 (open circles), CD19xRSV (open squares) and RSVxCD3 (open diamonds) BsAbs were grouped by Fc and individual values are plotted from two independent experiments. Lines represent the mean IC50 ± standard deviation (SD) through all tested molecules per Fc.n. c.: no competition for binding to FcγRI was observed at the highest applied concentration (2666 nM) for BsAbs containing an IgG2 σ1 Fc.
