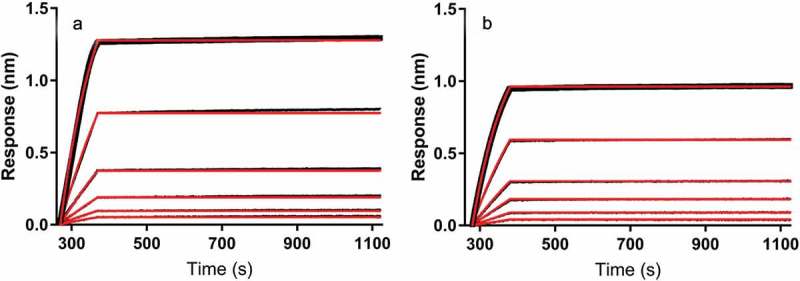
Figure 3.

Binding of mAb to biotinylated antigen at 137 mM NaCl in absence of HSA measured by BLI. Binding of mAb1 (a) and mAb2 (b) to biotinylated antigen was observed using biolayer interferometry at physiological salt concentration in phosphate buffer. Change in wavelength in nanometers (response, nm) is plotted as a function of time to indicate changes in thickness of the biolayer due to binding events. Association and dissociation steps are shown for 1.25 nM, 2.5 nM, 5 nM, 10 nM, 20 nM, and 40 nM mAb. Black traces indicate raw data and red traces indicate fitted curves. Data traces are aligned at the mAb association step, and reference data was subtracted from all sample traces.
