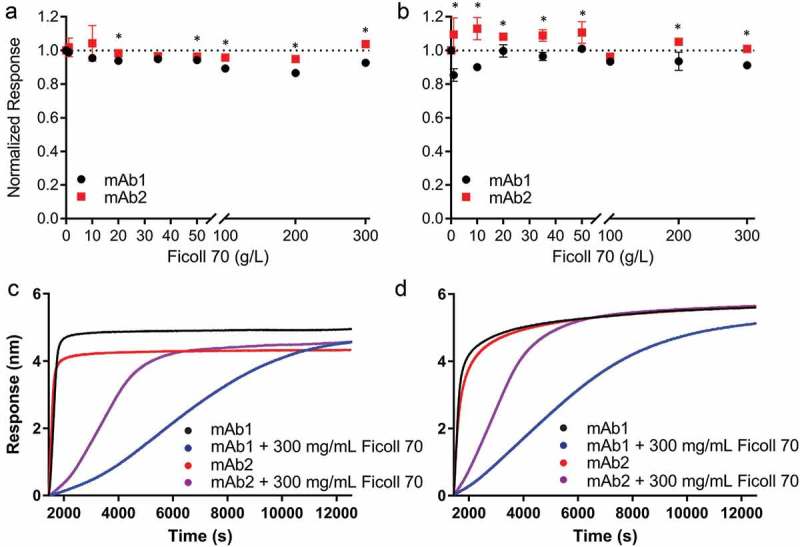
Figure 6.

Effect of Ficoll 70 on mAb binding to antigen measured by BLI. Binding of mAb1 (black circles) and mAb2 (red squares) to biotinylated antigen in the presence of increasing Ficoll 70 concentrations was observed by biolayer interferometry at 10 mM (panel a) and 137 mM (panel b) NaCl. The normalized response (to binding at 0.1 g/L Ficoll 70) is plotted as a function of Ficoll 70 concentration. The dotted line indicates the normal at 1.0, in order to illustrate the relationship of the data points to this line. Experiments were performed in triplicate, and the mean value and standard deviation are shown. One-way ANOVA was performed at each HSA concentration and p-values <0.05 are indicated with an asterisk. All data are summarized in Tables S5–7. Slow binding kinetics required an extension of the time for mAb association to antigen at very high Ficoll 70 concentrations (200 g/L and above, panels c and d). Binding of mAbs to biotinylated antigen in the presence of 300 g/L Ficoll was observed by biolayer interferometry at 10 mM (panel c) and 137 mM (panel d) NaCl. The aligned responses in nm for mAb1 (red) and mAb2 (black) in the absence of Ficoll 70 are shown as a function of time for an extended association time (~3 h). Addition of 300 g/L Ficoll 70 to mAb1 (blue) and mAb2 (purple) show comparatively slowed binding kinetics.
