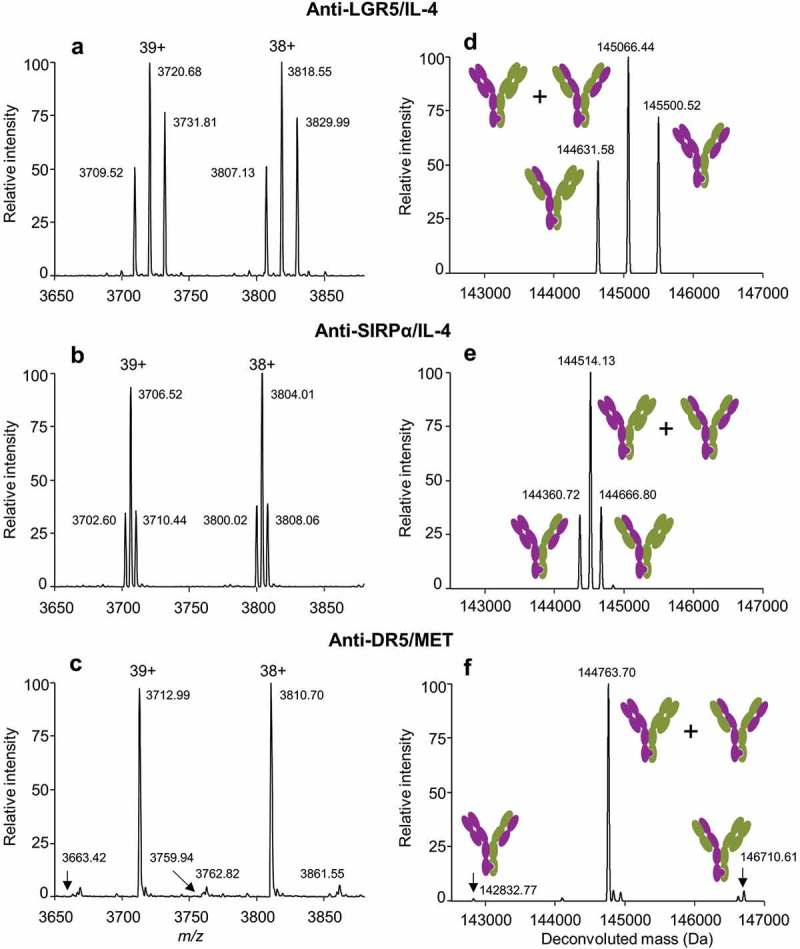
Figure 1.

High-resolution LCMS analysis profiles highlighting representative examples from Table 1 for (a and d) low (<30%), (b and e) intermediate (30–65%) or (c and f) high (>65%) yield of BsIgG1. Corresponding antibody pairs were transiently co-transfected into Expi293F cells. The IgG1 species were purified by protein A chromatography and SEC before quantification of the BsIgG1 yield by high-resolution LCMS.21,22 (a-c) Data shown are mass envelopes for charge states 38+ and 39+ along with (d-f) corresponding deconvoluted data. Also shown are cartoons representing the different IgG1 species present. See Table 1 for additional experimental details.
