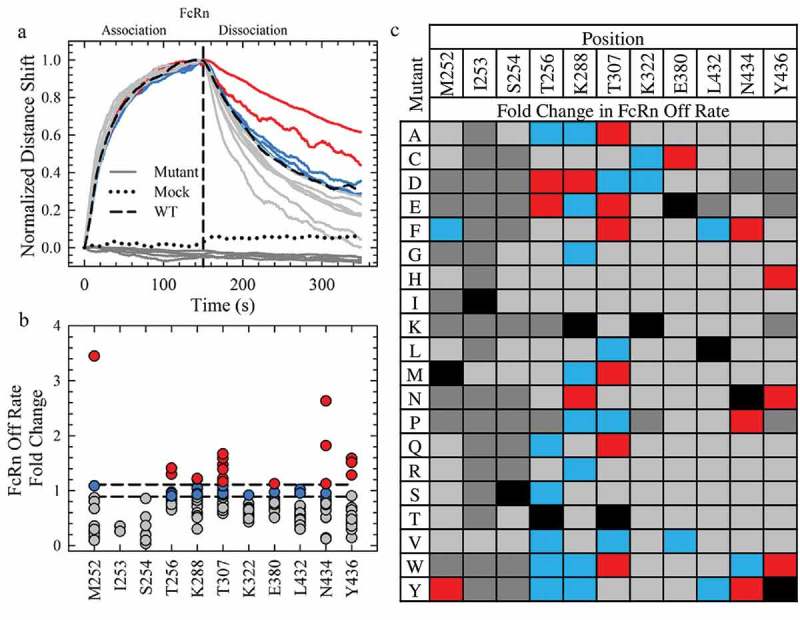
Figure 2.

Saturation Library Screening for Improved FcRn Off Rates. a. Normalization of the rFcRn binding kinetics at pH 6.0 of a subset of mutants (16) from the Octet screen. The mock and WT controls are represented by a black dotted and solid line, respectively. All mutants, represented by solid lines, fall into one of four categories: no FcRn binding (dark gray), faster (gray), WT-like (blue) or slower (red) rFcRn off rates compared to WT. The color scheme is identical for a, b and c. b. Scatterplot of the fold change in rFcRn off rate compared to WT. c. Fold change in the Octet FcRn binding off rates of the saturation library. WT positions are denoted by the solid black squares.
