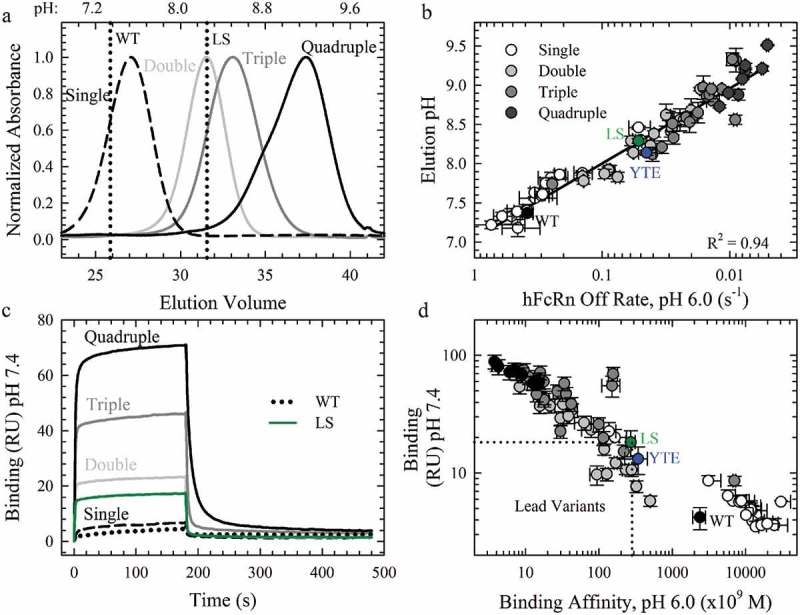
Figure 4.

The Effect of Combination Mutations on the pH-Dependence of the FcRn Interaction. a. Representative FcRn affinity chromatography elution profiles of the single WT and LS (vertical dotted lines) compared to the single (dashed line), double (gray line), triple (dark gray line) and quadruple (black line) combination variants. b. Plot of the elution pH as a function of the off rate at pH 6.0; (R2 = 0.94). c. Sensorgrams of the FcRn binding at pH 7.4 using Biacore for the WT (black dotted line), LS (green line) and representative combination variants. The color scheme is the same as in a. c. Comparison of the residual FcRn binding at pH 7.4 with the FcRn binding affinity at pH 6.0. Lead combinations with improved FcRn binding properties occupy the lower left quadrant. The color scheme is the same as in b.
