Figure 1.
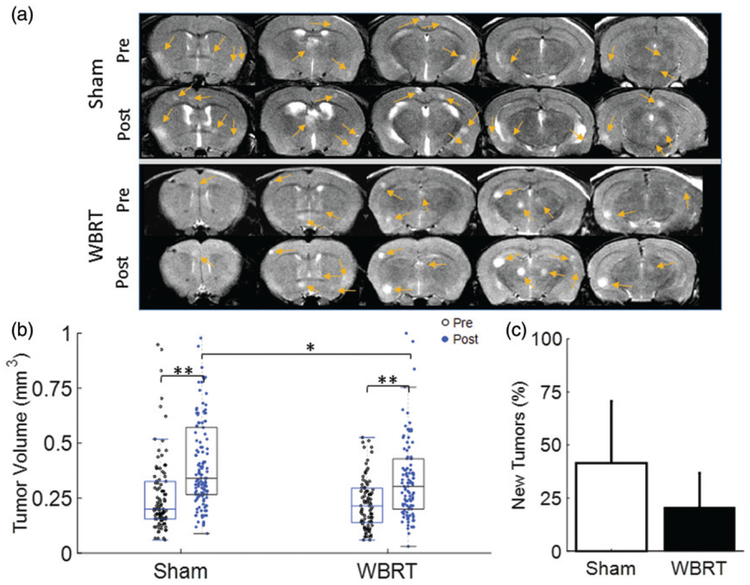
Tumor burden in response to WBRT. (a) T2-w images of a representative WBRT and Sham-treated mouse brain were acquired at pre and post-treatment, respectively. Five consecutive axial MRI sections revealed multifocal hyperintense lesions (arrows) in brains of both groups. (b) Tumor volume of individual brain metastases at pre (empty dot) versus post (solid dot) treatment was plotted. Significant increase in tumor volume at post-treatment was observed in each group: for the sham group, mean tumor volume = 0.28 ± 0.22 (n = 101) at pre increased to 0.44 ± 0.31 (n = 140; p < .01); for the WBRT, mean tumor volume = 0.23 ± 0.12 mm3 (n = 89) at pre increased to 0.34 ± 0.21 mm3 (n = 116; p < .01)). At post-treatment, the sham-treated tumors were found to be significantly larger than the WBRT tumors (p < .05). (c) An incidence of new tumor development at post-treatment was also studied. There was a 42 ± 29% increase in the number of brain lesions in the sham group, while a smaller increase (21 ± 16%) was found in the WBRT group. However, there was no significant difference between the groups. Mean ± SD, *p < .05, **p < .01.

