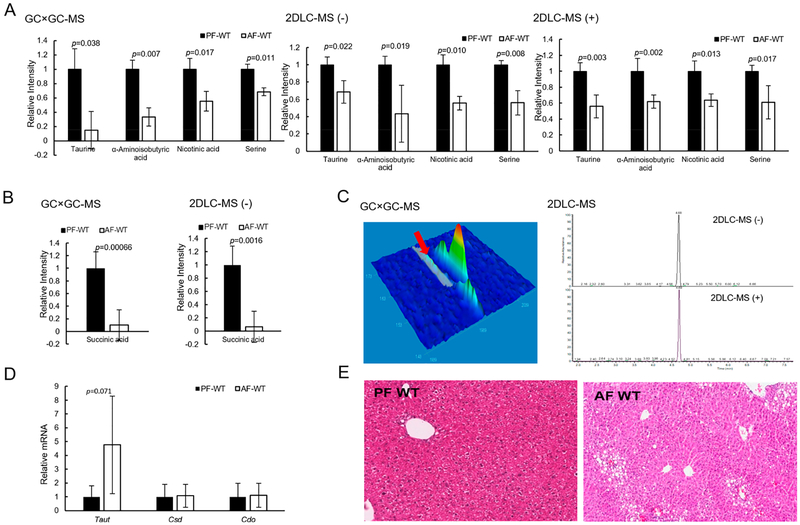
Figure 3.
Alcohol-feeding changed the amount of fecal metabolites and increased liver fat. (A) Abundance levels of the four metabolites detected by all three platforms. (B) Abundance levels of succinic acid in PF-WT mice and AF-WT mice detected by GC × GC-MS and 2DLC-MS (−). (C) shows the chromatographic peak shapes of taurine measured by GC × GC-MS, 2DLC-MS (−) and 2DLC-MS (+). (D) is gene expression of Taut, Csd, and Cdo in the liver tissues of PF-WT mice and AP-WT mice. (E) H&E staining of the liver tissues of PF-WT mice and AP-WT mice. AF, alcohol-fed; PF, pair-fed; WT, wild type.

