
Figure 4: Sdk modulates cell bond tension.
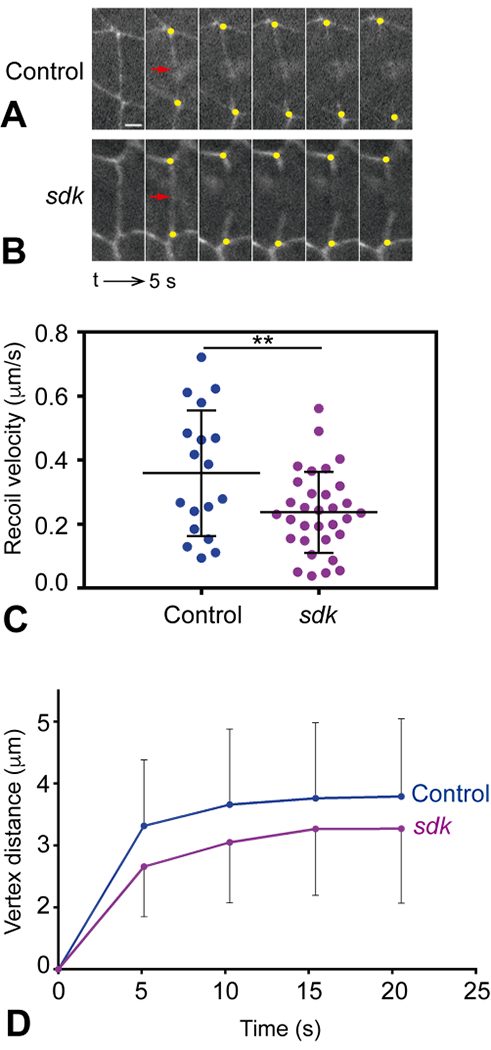
(A, B) Still images showing junction retraction after laser ablations in control ECad-GFP (A) and sdkMB05054; ECad-GFP mutant embryos (B). Cell junctions are visualized by the presence of ECad-GFP. The site of the cut is indicated by a red arrow and the recoiling vertices by yellow dots. Note the decreased recoil of vertices in sdk mutants. The sequence interval is 5 s. Scale bar, 2 μm. (C) Quantification of the recoil speed upon laser ablation in control and sdk mutant embryos. The recoil velocity in sdk mutants is lower, indicating reduced tension (Student’s t test, **p = 0.0098). (D) Quantification of vertex distance increase over time upon laser ablation in control and sdk mutant embryos. Vertex distance was normalized to the initial distance before ablation. Vertex displacement in sdk mutants is lower than in control embryos (Mann Whitney test, *p= 0.0181). n = 18 control embryos, n = 32 sdk mutants. Means ± SDs are shown in (C, D).