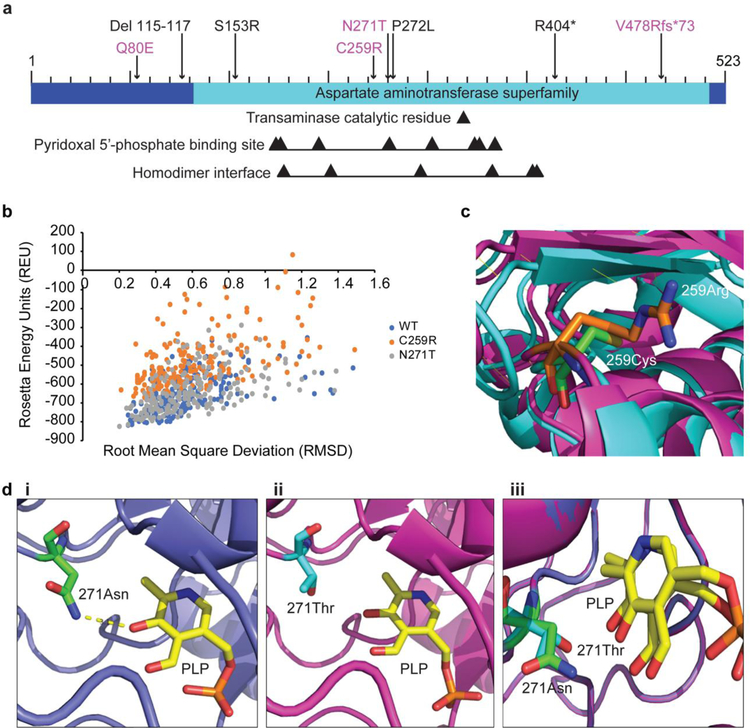
Fig 4.
Structural analysis of two deleterious GPT2 variants. a Bar diagram of the GPT2 protein, with mutations newly characterized in the current study indicated in magenta. Black arrows point to the transaminase catalytic residue, residues involved in binding of the coenzyme pyridoxal 5’-phosphate (PLP), and residues at the homodimer interface. b Stability analysis of wild-type (WT) GPT2 (blue) and the two GPT2 mutants C259R (orange) and N271T (gray), as reflected by Rosetta Energy Units (REU). REU is correlated with energy, which is an indicator of how stable the structure is (lower REU score = higher structure stability). c Visualization of the C259R GPT2 mutant. Wild-type GPT2 is shown in cyan, with C259 in green; mutant GPT2 is shown in magenta, with R259 in orange. di-iii Visualization of the N271T GPT2 mutant and PLP binding. Wild-type GPT2 is shown in blue, with N271 in green (i, iii); mutant GPT2 is shown in magenta, with T271 in cyan (ii, iii); PLP is shown in yellow (i-iii). A hydrogen bond between PLP and N271 is present in wild-type GPT2 (i, dashed yellow line), but is lacking in the N271T mutant (ii)

