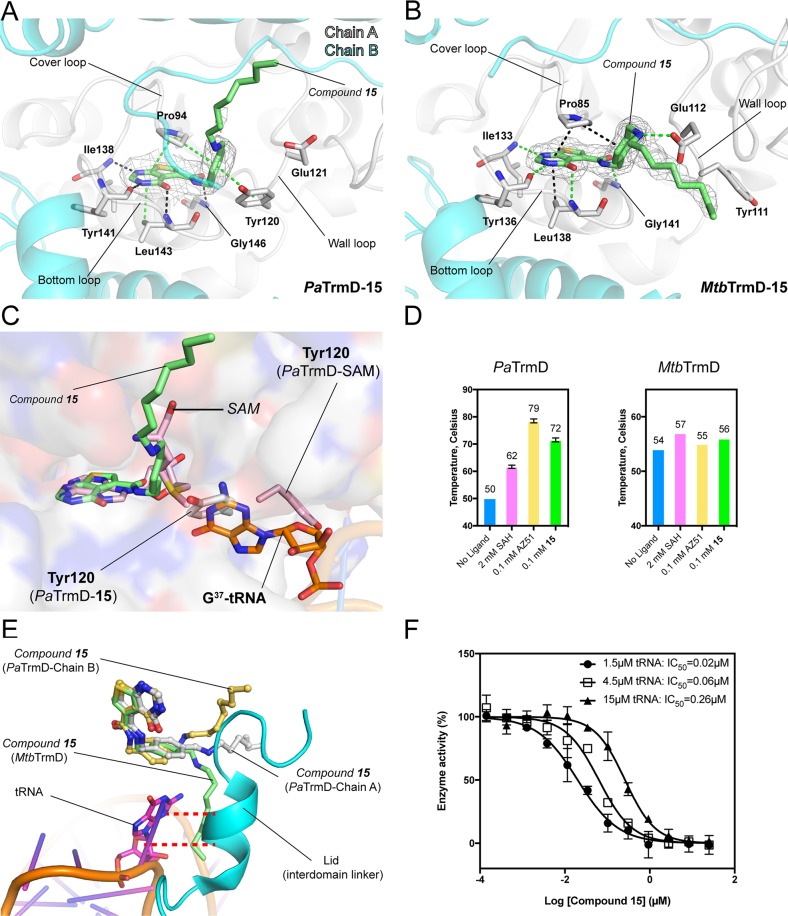
Figure 3.
Interactions of compound 15 with TrmDs. (A,B) The polypeptide chains are shown as cartoons, whereas the residues involved in inhibitor binding are shown as sticks. Ligands are shown as sticks with 2Fo – Fc electron density maps (gray) contoured at 1σ. (A) Detailed interactions between 15 and PaTrmD (chain A) (PDB 5ZHN). (B) The interactions between 15 and MtbTrmD (PDB 5ZHL). (C) In PaTrmD, compound 15 induces a conformational change of wall-loop residues, which could block substrate tRNA (G37) binding. SAM-bound PaTrmD and tRNA-bound H. influenzae TrmD (PDB 4YVI) were superimposed onto 15-bound PaTrmD, respectively. (D) The thermal shift of PaTrmD and MtbTrmD in the presence of SAH (2 mM), AZ51 (0.1 mM), or 15 (0.1 mM) was analyzed. Error bars represent mean ± SD. (E) A superposition of PaTrmD–15 (subunit 1 and 2), MtbTrmD–15, and HiTrmD–tRNA (PDB 4YVI) showing the close contacts between 15 and interdomain linker. The interdomain linker of HiTrmD (residues 157–174), and tRNA are shown as cartons, whereas guanosine is shown as stick. (F) Dose-dependent inhibition of PaTrmD at varying tRNA titrations. The IC50 values determined for compound 15 at tRNA concentrations of 1.5 μM (●), 4.5 μM (□), and 15 μM (▲), respectively, are 0.02 ± 0.01, 0.06 ± 0.01, and 0.26 ± 0.02 μM, respectively. Each data point represents an average of duplicate experiments with error bars indicated as SD.

