
Figure 4.
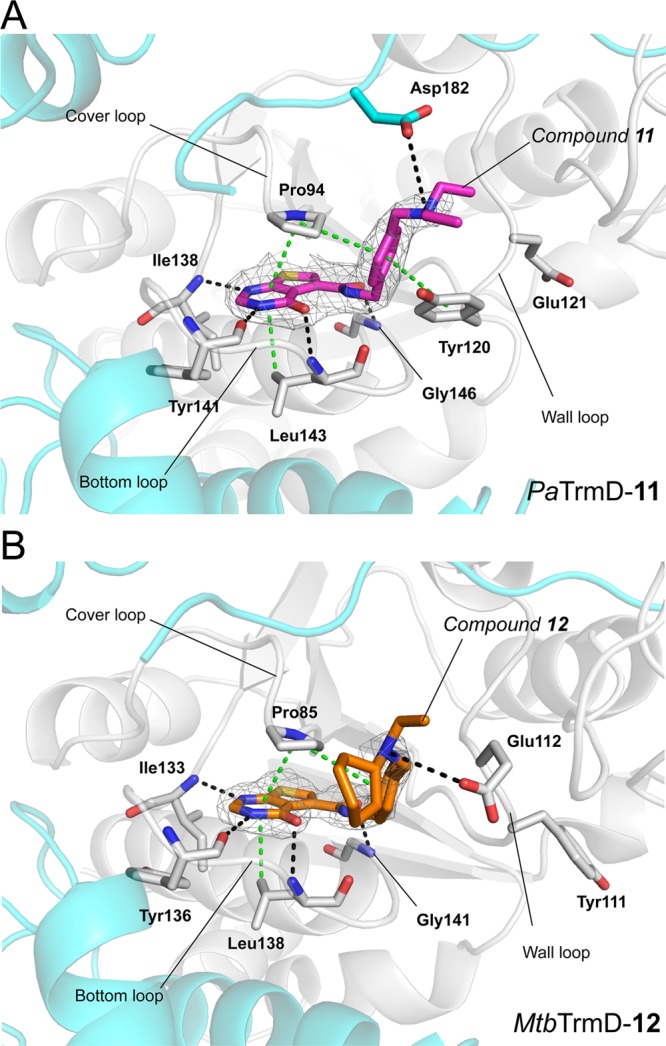
Crystal structures of compound 11 bound to PaTrmD (A; PDB 5ZHM) and compound 12 bound to MtbTrmD (B; PDB 5ZHK), respectively. The polypeptide chains are shown as cartoons, whereas the residues involved in inhibitor binding are shown as sticks. Ligands are shown as sticks with 2Fo – Fc electron density maps (gray) contoured at 1.0σ. Potential interactions involved in inhibitor binding are indicated by broken lines (black, hydrogen bonds; green, hydrophobic contacts including stacking interactions).