Figure 12.

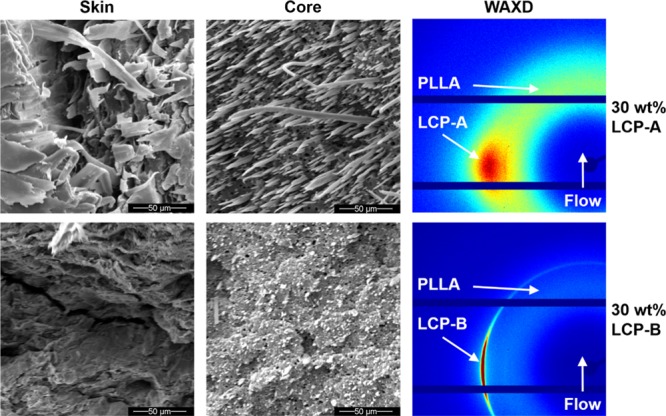
Microstructure of injection-molded samples: SEM-images of sample skin (left), SEM-images of sample core (middle), diffractograms (right).

Microstructure of injection-molded samples: SEM-images of sample skin (left), SEM-images of sample core (middle), diffractograms (right).