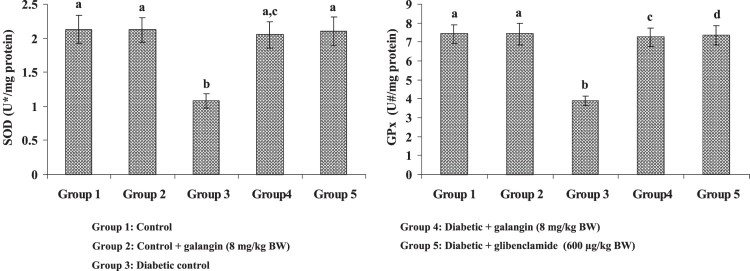
Figure 3.
Effect of galangin on liver mitochondrial enzymic antioxidants of STZ-caused hyperglycemic rats. Data are means ± SEM, n = 6. Groups 1 and 2 significantly are not different (a, a) (P < 0.05). Groups 4 and 5 are different significantly compared to group 3 (b vs. ac, a, c, d) (P < 0.05). U* – Enzyme concentration required for 50% inhibition of NBT reduction/min s. U# – µmol of reduced glutathione consumed/min.

