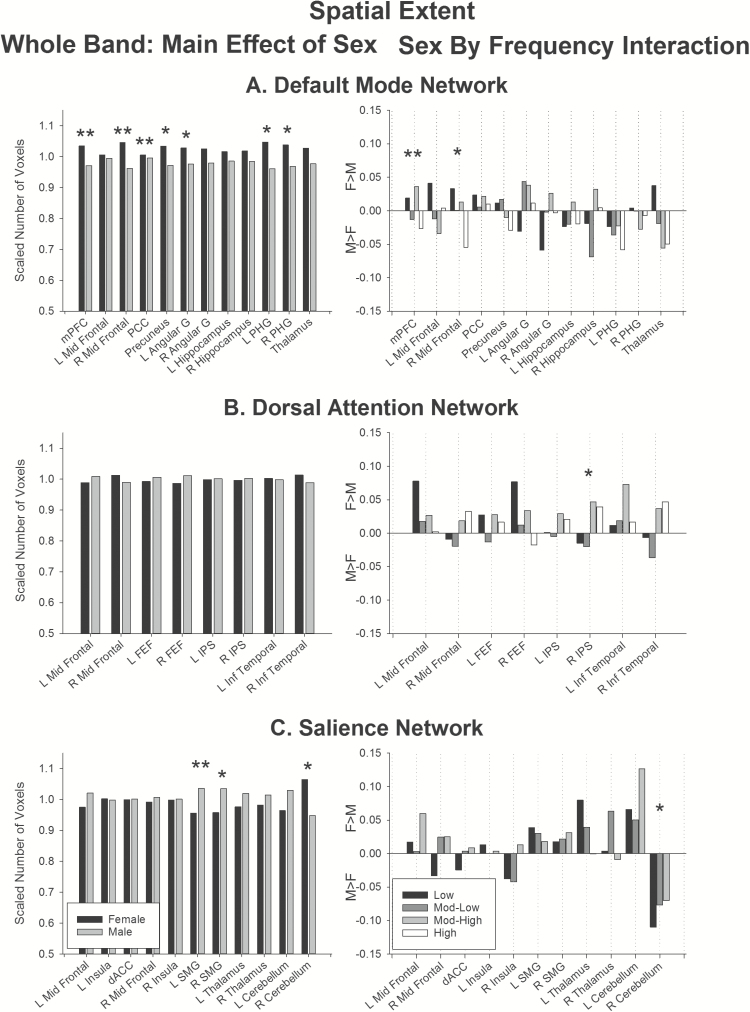
Figure 3.
Effect of sex on spatial extent. (Left) Main effect of sex in the whole band data. (Right) Sex by Frequency interaction. Bars represent female–male differences. Positive values show regions showing greater extent for females than males, negative values show regions showing greater extent for males than females. Double asterisks indicate regions significant above the threshold corrected for multiple comparisons. Single asterisks indicate regions that did not survive correction for multiple comparisons. Abbreviations: angular, angular gyrus; dACC, dorsal anterior cingulate cortex; FEF, frontal eye fields; IPS, intraparietal sulcus; Inf temporal, inferior temporal gyrus; L, left; mPFC, medial prefrontal cortex; mid frontal, middle frontal gyrus; PCC, posterior cingulate cortex; PHG, parahippocampal gyrus; SMG, supramarginal gyrus; R, right.

