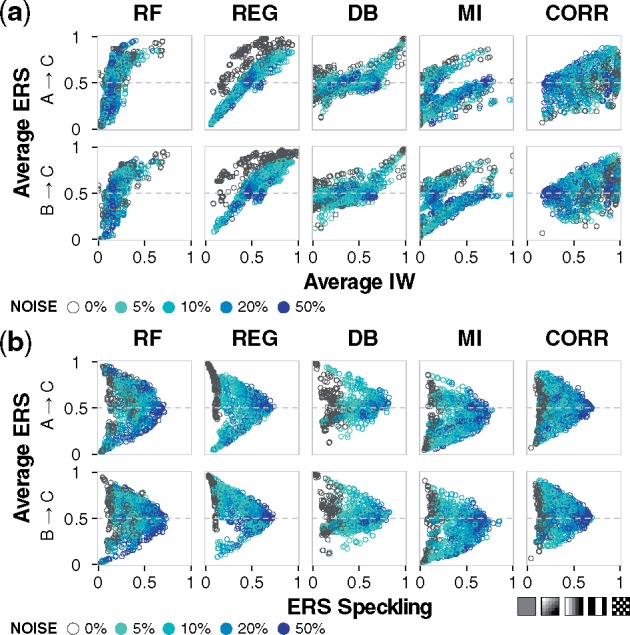
Fig. 4.

Robustness to noise in the sampled data. (a) Gaussian noise at 5, 10, 20 or 50% of the unit-scaled standard normal distribution was added to the sampled data. Joint distribution of average IW and average ERS. Each point summarizes results for a specific combination of motif, gate, stimulus target, and sampled time interval. (b) Joint distribution of ERS speckling and average ERS. With increasing levels of noise, the ERS speckling as a function of the kinetic landscape (Fig. 2b) increases and average algorithm performance converges to the null case. In the lower right, cartoon patterns depict an example trend for increased speckling. Additional simulation conditions and plots are available in the Supplementary Material and online data browser
