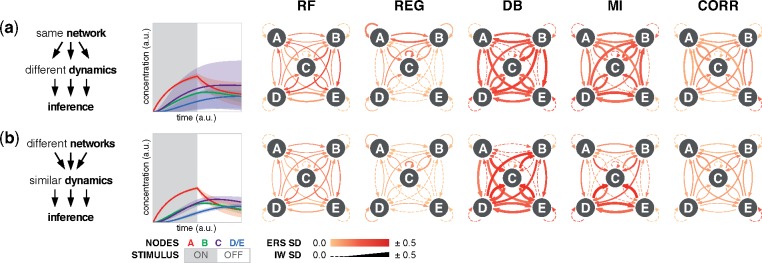
Fig. 5.
Robustness to kinetic and topological variation. (a) A network topology can produce highly distinct data depending on the kinetic parameters. In the case shown, nine networks each have a FFFB motif, an AND gate, and stimulus to node A, but differ in gate kinetics. Left: the timecourse mean trajectories (line) and standard deviation (SD; shaded region) from the nine networks. Right: SD of IW (line width) and ERS (color coded) for each edge. Dashed lines indicate zero SD for IW. (b) In the reciprocal case, nine networks differ in motifs, gates, and kinetics, but all produce highly similar data. Individual plots are in the Supplementary Material, and additional simulation conditions are available in the online data browser

