Fig. 1.
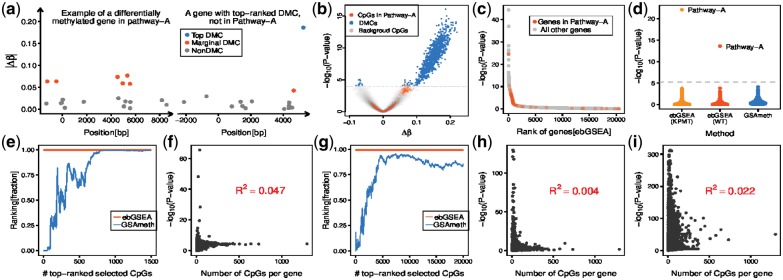
Validation of ebGSEA. (a) Example of a differentially methylated gene mapping to a hypothetical ‘pathway-A’, and of a gene containing a top-ranked DMC not mapping to pathway-A. Y-axis labels the absolute differential methylation between two phenotypes. Each datapoint corresponds to a CpG mapping to the gene, with the position relative to the transcription start site (x=0). (b) Volcano plot of the resulting DMCs with the grey dashed line indicating the line of significance (FDR=0.05). (c) Significance (y-axis) versus rank position of the gene (x-axis), as ranked by ebGSEA. (d) Significance of 8567 biological terms, as assessed using GSAmeth and ebGSEA combined with either a Wilcoxon test or the Known Population Median test. Dashed line marks Bonferroni threshold. (e) Plot of the rank position (expressed as a fraction) of a biological term containing genes overexpressed in smoking-related head&neck cancer in a smoking-EWAS performed in buccal swabs versus the number of top-ranked selected CpGs used in GSAmeth (blue line). Red line indicates the rank position of the same term under ebGSEA. (f) Significance of the genes, as given by ebGSEA, versus the number of CpGs mapping to the gene, as derived using ebGSEA in the same smoking-EWAS. R2 value demonstrates that ebGSEA is unbiased. (g–h) As (e–f), but now for a term of transcriptionally altered genes in an age-EWAS performed in blood. (i) As panels f and h, but now for rheumatoid arthritis in an EWAS performed in blood

