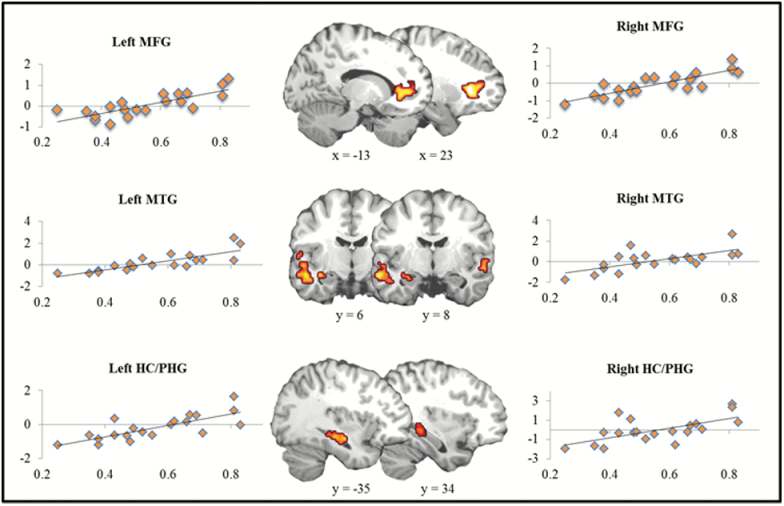
Figure 3.
Individual differences in false memory. Activation maps represent regions, including bilateral middle frontal gyrus (MFG), bilateral middle temporal gyrus (MTG), and bilateral hippocampus/parahippocampal gyrus (HC/PHG), where neural activity was correlated with false memory rate. X-axis represents beta values from neural signal. Y-axis represents percentage of related false alarms.

