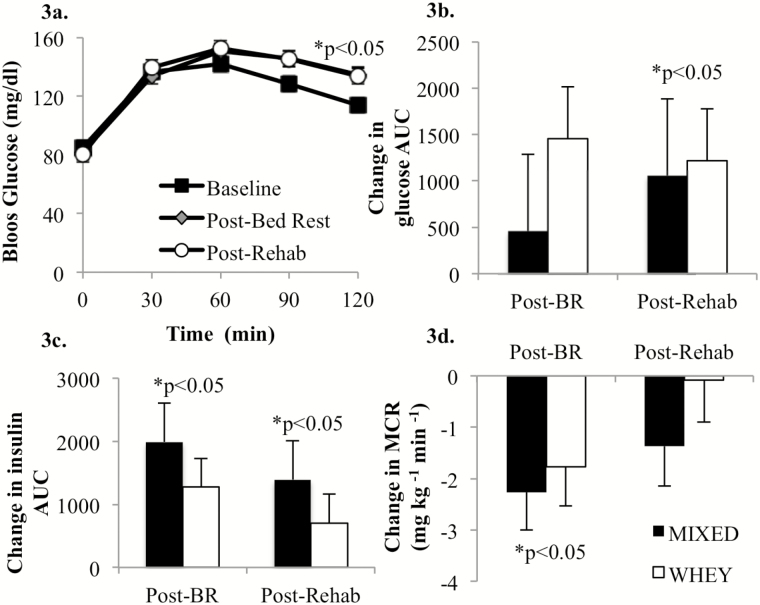
Figure 3.
There was no effect of diet on blood glucose concentration response to the oral glucose tolerance test following disuse and rehabilitation (Time × Trt, p = .39), so for clarity of presentation, the groups were collapsed at each time point (a). Blood glucose concentration was characteristically elevated in response to the 75-g oral glucose challenge and was significantly elevated (p < .001) at 30, 60, 90, and 120 min compared with 0 min at baseline, post-bed rest, and post-rehabilitation (a). The 120-min glucose concentration following bed rest and rehabilitation was significantly higher than baseline (p < .05; a). Blood glucose area under the curve (AUC) did not change during bed rest (p = .36), but significantly increased following rehabilitation (p < .05; b). Insulin AUC was significantly increased (p < .05) following bed rest and remained elevated (p < .05) following rehabilitation (c). The metabolic clearance rate (MCR) significantly decreased during bed rest (p < .05), but was no longer significantly different from baseline following 7 d of rehabilitation (d).

