
4.
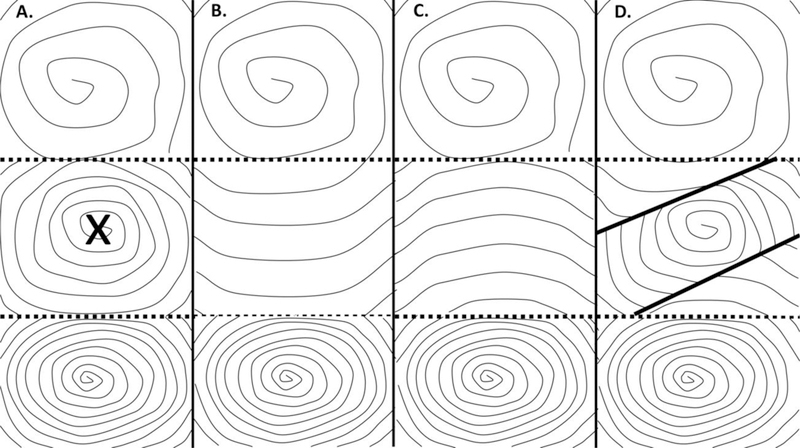
Diagram showing how ablation lesions affect local cycle length for activation, based on timing considerations as addressed by the cellular automaton. A. rectangular (patch) ablation lesions, marked with an x. This will eliminate the center rotational driver. B. The middle region is now activated at a slower rate by the top driver. C. Alternatively, the middle region is now activated at a slower rate by the lower driver with 2:1 conduction alternans into the center region. D. In this panel, simulated linear ablation (thick lines) are applied in proximity to the center rotational driver. Areas then shielded from the center driver arethen driven at a slower rate by the drivers at top and bottom of the panel.