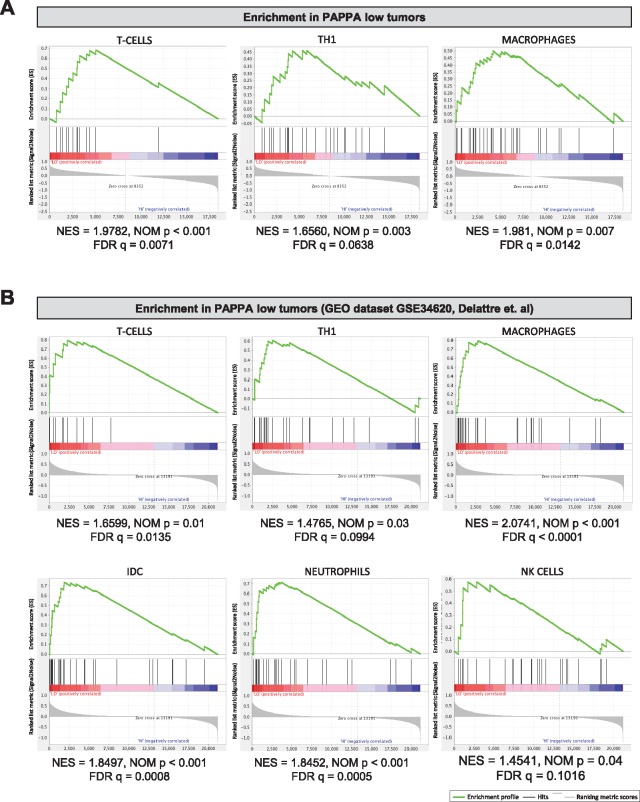
Figure 8.
Association of PAPPA expression in Ewing sarcoma (EWS) with the abundance of tumor-infiltrating immune cells. A) Gene set enrichment analysis of gene signatures of various immune cells based on Bindea et al. (38) in our RNAseq data of PAPPA-low (n=20) compared to PAPPA-high (n = 20) primary EWS tumors and in (B) the GEO dataset Delattre et al. (GSE34620). Normalized enrichment score (NES), FDR, and P values were calculated using gene set enrichment analysis (GSEA) software. FDR = false discovery rate; NOM p = Nominal P Value.

