. 2019 Sep 17;8:e49266. doi: 10.7554/eLife.49266

Figure 2. Kinetics of actomyosin attachment durations under mechanical load.

(a) Cumulative distributions of actomyosin attachment event durations at 1 μM ATP under assisting loads (solid lines) plotted on semi-log axes. Best fits from the loglikelihood ratio test (Woody et al., 2016) are shown as dashed lines. Low-load data (<0.5 pN) from non-feedback experiments are shown in grey with a single exponential fit. The other fitted curves are double or triple exponential cumulative distributions as explained in the text. Inset shows the same data on a linear scale. (b–e) Comparison of cumulative distributions of durations under hindering loads listed in each panel with no added phosphate (lighter lines) and 10 mM added phosphate (dark lines). (f) Fitted rate constants from the multi-exponential functions which describe the data with no added phosphate (solid symbols) and 10 mM Pi (open symbols). Positive forces (hindering loads) are defined as the direction that opposes the progression of the myosin working stroke. Blue symbols give the slowest of the fitted rates (ks), red the fastest rates (kf), and green the intermediate rate (kint) in the cases where three rates were statistically justified. Black symbols are the single rate constant fitted to the non-feedback data from the same molecules. (g) Fraction of observed interactions that were rapid (Af + Aint) from the multicomponent exponential fits for no added Pi (blue) and 10 mM Pi (red). (h) Relative fraction of rapid events for 10 mM added Pi compared to 0 Pi, {(Af+Aint) at 10 mM Pi} / {(Af+Aint) at 0 mM Pi}. Error bars in f) – h) give 68% confidence intervals (90% in h)) from 500 rounds of bootstrapping (Woody et al., 2016). Numbers of events, 784 to 1502, from 5 to 8 molecules at each [Pi] (See Supplementary file 1 Table 1 for details).

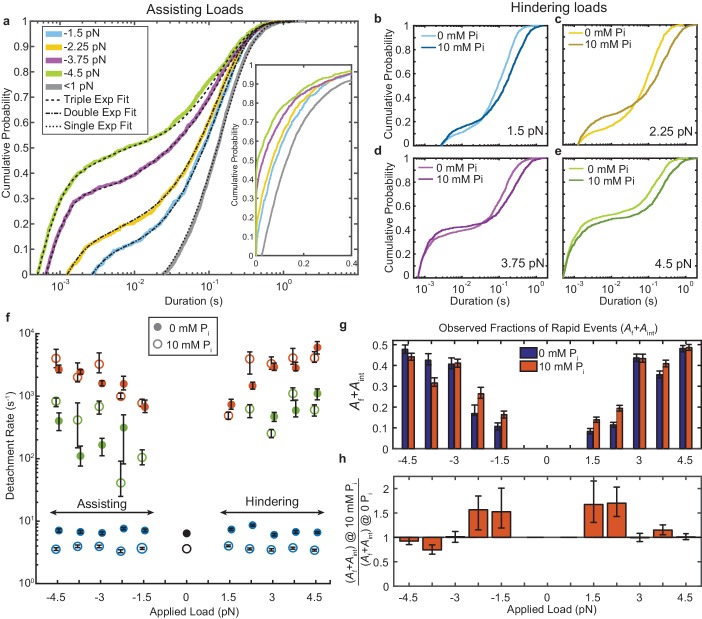
Figure 2—source data 1. Matlab figure files with data from Figure 2.
DOI: 10.7554/eLife.49266.008

Figure 2.

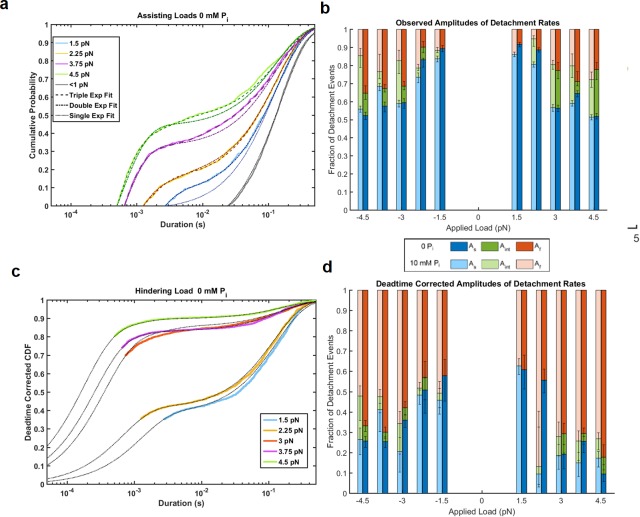
Figure 2—figure supplement 1. Attachment durations and fitted distributions.

Figure 2—figure supplement 1.

(a) Data from Figure 2a plotted as cumulative density functions (CDFs) with fitted distributions incorporating 1–3 exponential components as indicated in the symbol key, showing that for forces > 2.25 pN the sum of three exponential components was statistically justified. (b) The amplitudes (relative fraction) of each fitted rate constant, kf (Af, red), kint (Aint, green), and ks (As, blue) for data with 0 (dark bars) and 10 mM (light bars) added Pi. (c) Plot of the cumulative distribution functions at 0 mM Pi and hindering loads correcting for events that are missed by the experimental deadtime assuming exponential distributions (see Materials and methods). Most of the events lost in the deadtime are part of the fastest phase. Black dotted lines show fits to the data and extrapolate back to the zero CDF and duration (not shown). (d) Similar plot to panel b, but showing the amplitudes of each component after correcting for the experimental deadtime. The amplitude of the fast component (red) is considerably larger at each force than in panel b due to the loss of these events in the deadtime. Error bars are 68% confidence intervals from 500 rounds of bootstrapping for all panels.
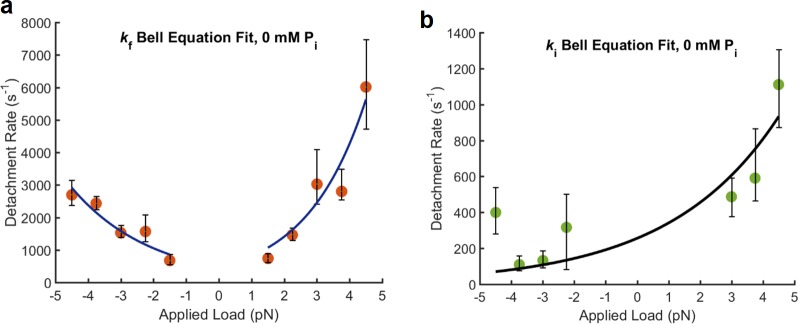
Figure 2—figure supplement 2. Force dependence of fast and intermediate detachments at 0 Pi and 1 μM MgATP.

Figure 2—figure supplement 2.

(a) Data for kf from Figure 2a. To describe the force dependence of these rates, the Bell equation was used: k(F)=k0expFdkT, where k is the force dependent rate, k0 is the unloaded rate, (F) is the applied force, (d) is the distance parameter indicating the force dependence of the transition, k is Boltzmann’s constant, and T is the absolute temperature. Because the data show increasing rates as the magnitude of the force increases under either positive or negative loads, the Bell equation was fitted to the kf values separately for assisting (negative) and hindering (positive) loads. For assisting loads k0 = 579 (369–789, 68% CI) s−1 and d = −1.47 (−1.84 – −1.06), 68% CI) nm, and for hindering loads k0 = 354 (127–581, 68% CI) s−1, d = 2.54 (1.90–3.18, 68% CI) nm. (b) Because kint shows a general trend of increasing rate as the load becomes more positive (more hindering load), the fit for kint was performed on positive and negative data but excluded the point at −4.5 pN. k0 = 256 (131–381, 68% CI) s−1, d = 1.18 (0.67–1.68, 68% CI) nm.
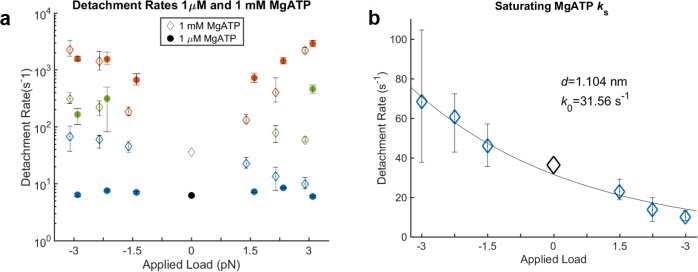
Figure 2—figure supplement 3. Kinetics of actomyosin detachment in the presence of 1 mM MgATP.

Figure 2—figure supplement 3.

(a) Fitted detachment rate constants, kf (red), kint (green), and ks (blue) in the presence of 1 μM MgATP (closed circles, same data as in text Figure 2f) and 1 mM MgATP (open diamonds). The zero-load rates (black) are from non-feedback experiments. kf and kint do not vary systematically between low and high ATP concentration, while ks is faster and more force dependent at 1 mM than at 1 μM MgATP. (b) ks at 1 mM MgATP with a fitted Bell equation, yielding a distance parameter of 1.1 nm. The estimated unloaded rate (k0 = 31.5 s−1) is slightly less than some previous measurements (50–70 s−1), which may be at least partially due to mixing of the slow and intermediate phases in the fitted parameters. Such mixing may also be responsible for the differences in kint for 1 μM vs. 1 mM MgATP under resisting loads.