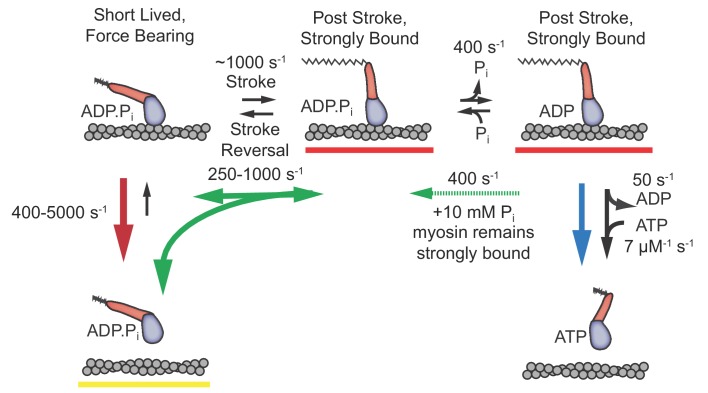
Figure 6. Proposed model with short-lived, weakly-bound attachments directly preceding the working stroke, which is followed by phosphate release and potential phosphate rebinding.
Rates constants are estimates at zero load (lowest values) to 4.5 pN of hindering load (highest values). Colored arrows indicate processes associated with detachment rate kf (red), kint (green), and ks (blue). Dashed green arrow is only relevant when 10 mM Pi is added. Red underlined states indicate myosin is strongly bound, while yellow underlines indicate a weakly bound or unbound state.

