. 2019 Sep 17;8:e47804. doi: 10.7554/eLife.47804

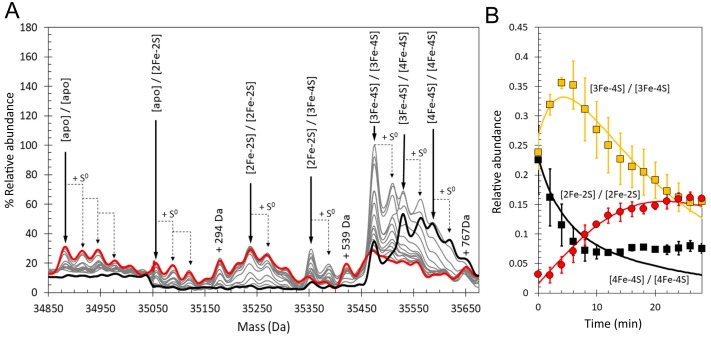
Figure 10. Time-resolved ESI-MS analysis of dimeric RirA cluster conversion under anaerobic, low iron conditions.

(A) Deconvoluted mass spectrum of [4Fe-4S] RirA prior to the addition of 250 µM EDTA (black line) and 30 min after the addition at 37°C (red line) and at intervening time points (grey lines). [4Fe-4S] RirA (~25 µM) was in aerobic 250 mM ammonium acetate pH 7.3. Low iron conditions were generated by the addition of 250 µM EDTA and cluster conversion/degradation was followed at 37°C. The peak at +294 Da could represent an EDTA adduct of the apo-RirA dimer. (B) Plots of relative ESI-MS abundances of [4Fe-4S]/[4Fe-4S] (black), [3Fe-4S]/[3Fe-4S] (yellow), and [2Fe-2S]/[2Fe-2S] (red) forms of RirA as a function of time following exposure to 250 µM EDTA at 37° C. Fits of the data generated by a global analysis of the ESI-MS data based on the reaction scheme depicted in Figure 10—figure supplement 1 are shown as solid lines. Error bars show standard error for ESI-MS dataset (n = 2 derived from two biological replicates).

Figure 10.

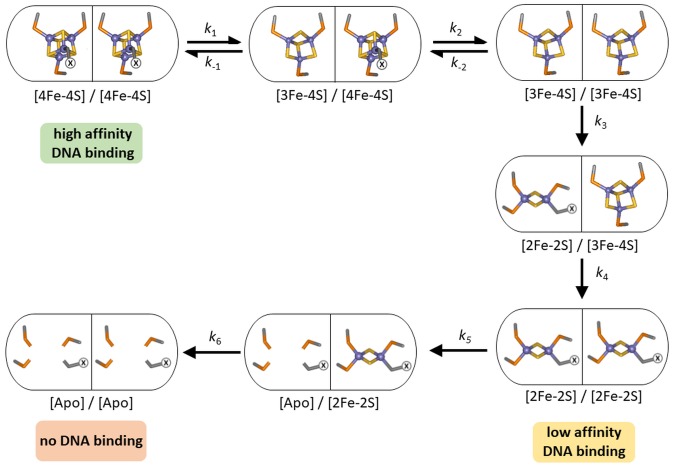
Figure 10—figure supplement 1. Proposed reaction scheme for dimeric [4Fe-4S] RirA cluster conversion/degradation.

Figure 10—figure supplement 1.

Reaction scheme used to fit time resolved ESI-MS data for dimeric [4Fe-4S] RirA. Values of rate constants (k) are given in Supplementary file 2. Note that in some cases the ESI-MS data cannot unambiguously determine the identity of the intermediate species because the distribution of iron and sulphurs between two RirA monomers is unknown. However, a global fit of the data based on the illustrated mechanism is reasonable. The initial RirA [4Fe-4S] cluster is coordinated by three Cys residues and one unknown ligand, illustrated in the figure as ‘X’.
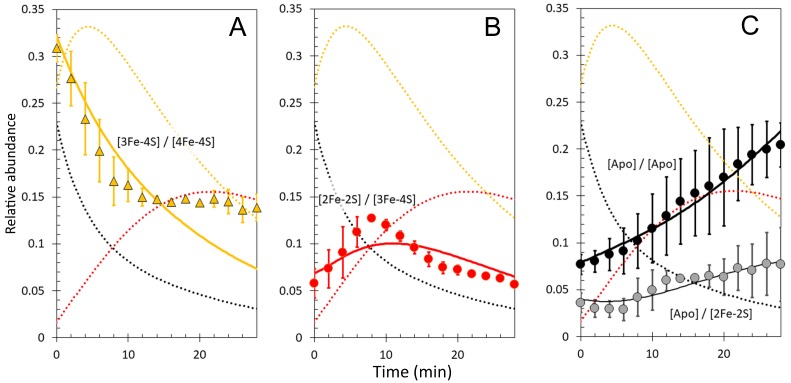
Figure 10—figure supplement 2. Kinetic analysis of dimeric [4Fe-4S] RirA cluster conversion/degradation.

Figure 10—figure supplement 2.

Plots of relative ESI-MS abundance of [3Fe-4S]/[4Fe-4S] (A), [2Fe-2S]/[3Fe-4S] (B) and [apo]/[2Fe-2S] and [apo]/[apo] (C) RirA as a function of time following exposure to 250 µM EDTA at 37° C, Fits of the data generated by a global analysis of the ESI-MS data based on the reaction scheme depicted in Figure 10—figure supplement 1 are shown in solid lines. Broken lines correspond to the kinetic profile of the species associated with that colour (see Figure 10 of the main paper) and are included to permit easy comparison between intermediates. Error bars show standard error for average MS dataset (n = 2).
Figure 10—figure supplement 3. Plot of ESI-MS relative abundances of [3Fe-4S]/[3Fe-4S].
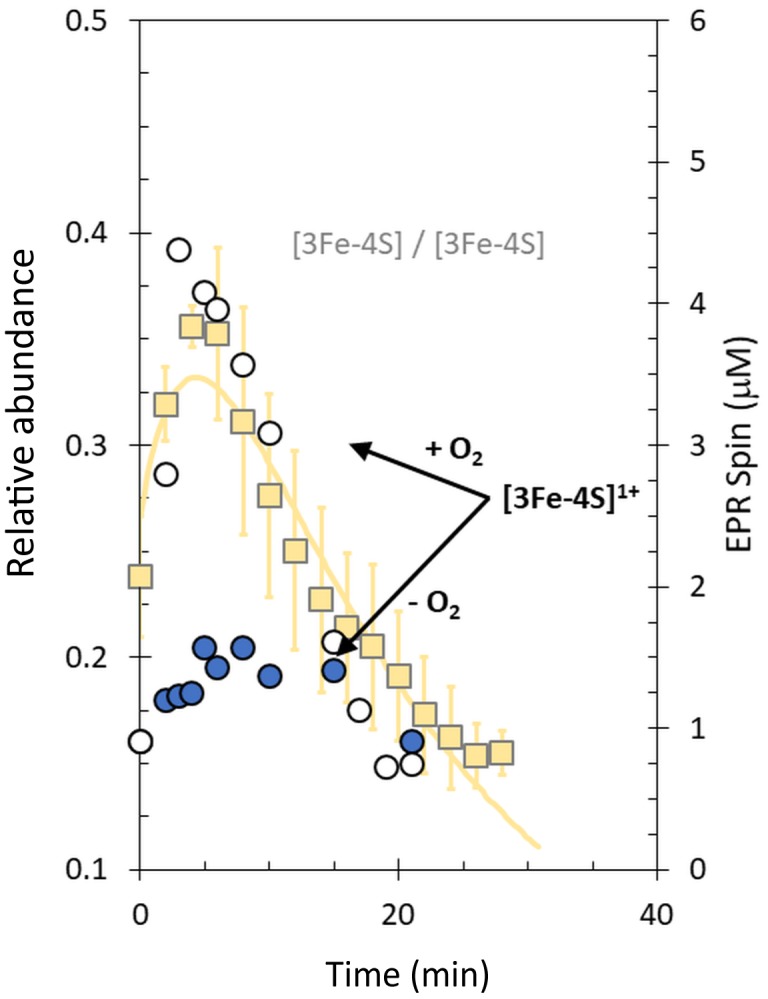
Figure 10—figure supplement 3.

RirA species as a function of time following exposure of RirA [4Fe-4S] to 250 µM EDTA at 37° C and aerobic conditions (yellow squares) and RirA [3Fe-4S]1+ cluster determined under identical condition by EPR under aerobic (+O2, white-filled circles) and anaerobic (-O2, blue-filled circles) conditions (see Figure 8). The solid yellow line represents the global fit to the ESI-MS data (as shown in Figure 7). [4Fe-4S] RirA (~25 µM) was in aerobic (~228 µM O2) 250 mM ammonium acetate pH 7.3.