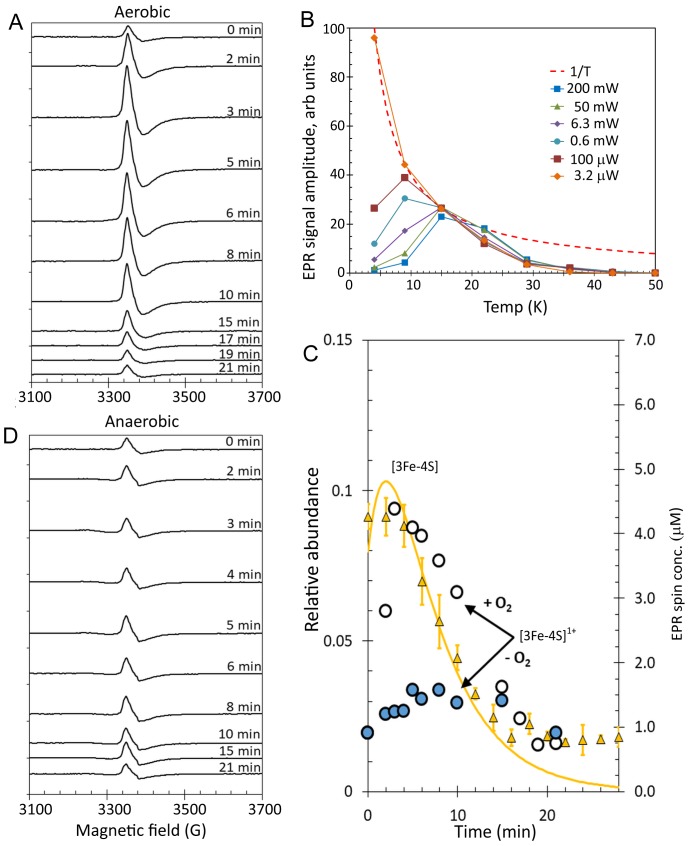
Figure 8. EPR analysis of [4Fe-4S] RirA cluster conversion under aerobic and anaerobic low iron conditions.
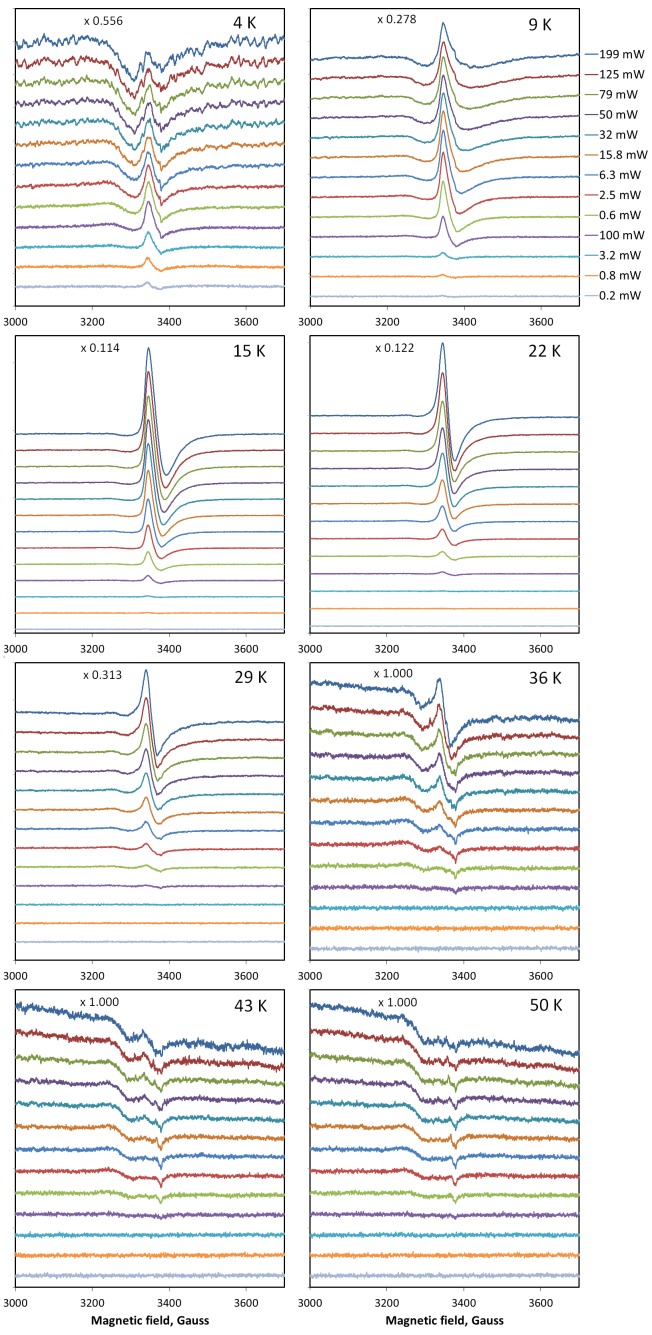
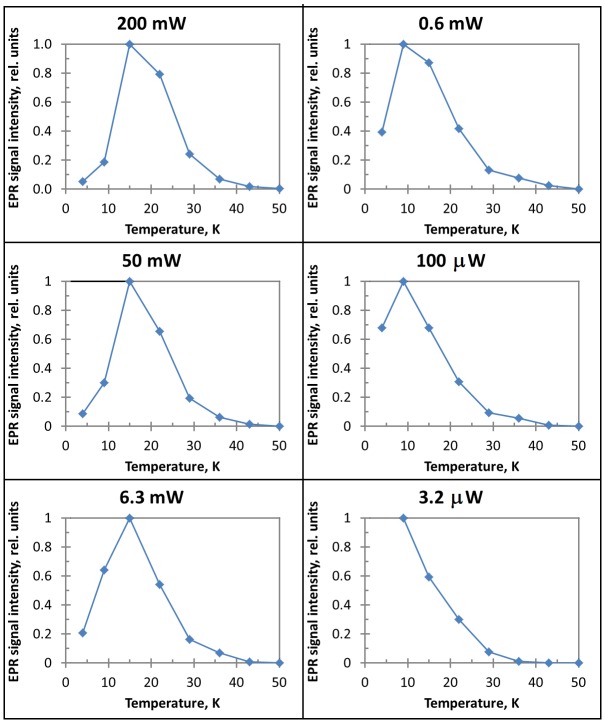
(A) EPR spectra of [4Fe-4S] RirA at specified time points following the addition of 250 µM EDTA under aerobic conditions at 37°C. (B) Plot of g = 2.01 EPR signal intensity dependence on temperature at a range of microwave powers. The dashed red line represents a hyperbolic 1/T function plotted in arbitrary units to represent the Curie law (when no saturation effects take place). All experimental dependences are individually scaled so that each meets the hyperbola via at least one data point, with remaining data points lying below the hyperbola (indicating that the signal saturates). (C) Plot of ESI-MS relative abundances of RirA [3Fe-4S] cluster as a function of time following exposure of RirA [4Fe-4S] to 250 µM EDTA at 37° C and aerobic conditions (yellow triangles) and RirA [3Fe-4S]1+ cluster determined under identical condition by EPR under aerobic (+O2, white-filled circles) and anaerobic (-O2, blue-filled circles) conditions. The solid yellow line represents the global fit to the ESI-MS data (as shown in Figure 7). (D) As in (A) but under anaerobic conditions. [4Fe-4S] RirA (~25 µM) was in aerobic (~228 µM O2) 250 mM ammonium acetate pH 7.3.


