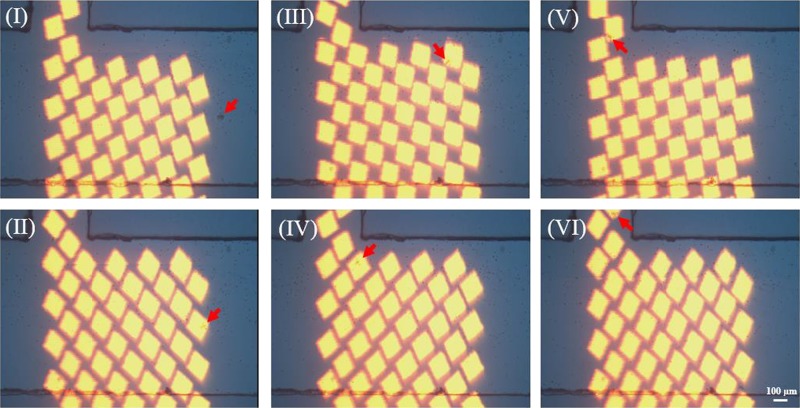
FIG. 11.
ODEP-based isolation of CTC clusters. (I) and (II) A dynamic square light image trapped a cell cluster (red arrow) passing through the incident optical pattern; (II) and (III) the trapped cell cluster moved to one side of main microchannel; (III)–(V) the cell cluster was trapped again at the entrance of side microchannel; (V) and (VI) the trapped cancer cell cluster was pushed into the side microchannel for collection. Reproduced with permission from Chiu et al., Sens. Actuators B Chem. 258, 1161 (2018). Copyright 2018 Elsevier Publishing.

