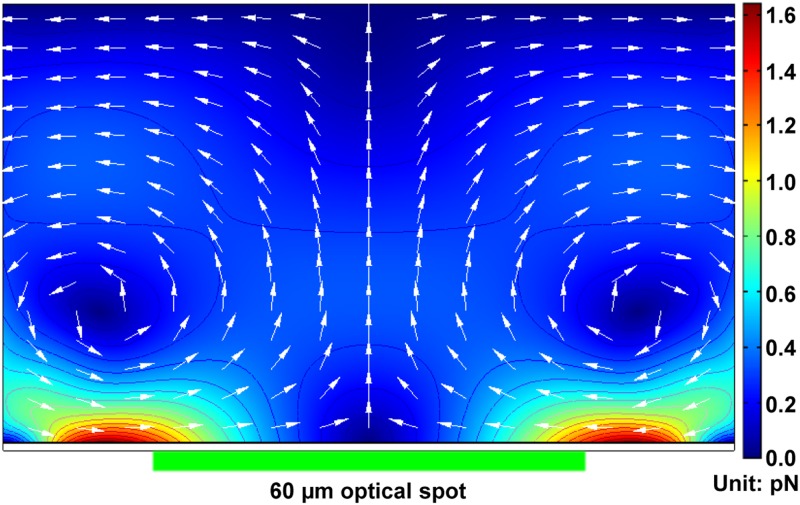
FIG. 4.
FEA results of how the ACEO flow is spatially distributed in the OEK chip. The arrows and the surface color indicate the direction and magnitude of the ACEO force (unit: pN), respectively; the magnitude of the ACEO between any two adjacent isolines is 0.1 pN. Reproduced with permission from Liang et al., Opt. Mater. Express 4, 2368 (2014). Copyright 2014 OSA Publishing.

