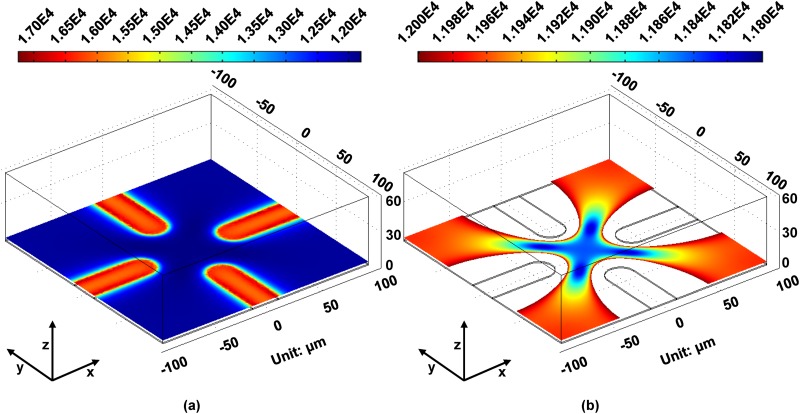
FIG. 8.
FEA results of the distribution of the optically-induced electric field. (a) Distribution of the electric field induced by four orthogonal optical patterns; (b) the local electric field distribution at the central areas, showing the uniform electric field in blue. Reproduced with permission from Liang et al., Biomicrofluidics 9, 014121 (2015). Copyright 2015 AIP Publishing LLC.

