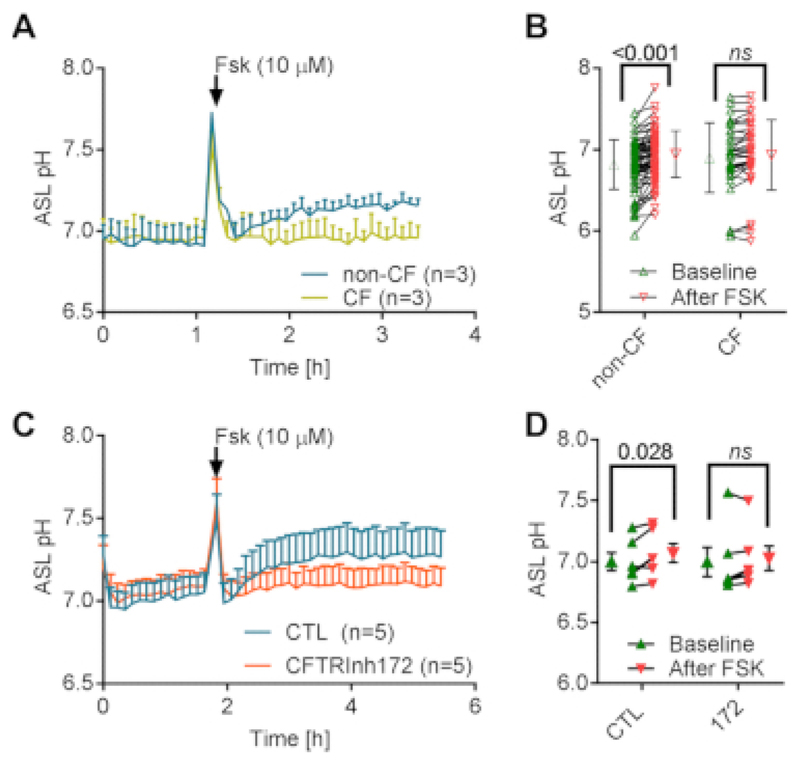
Figure 4. Dynamic ASL pH measurement in response to CFTR activation by forskolin.
(A) Representative traces of the effect of forskolin (Fsk, 10 µM) on the kinetics of ASL pH over time in non-CF and CF hAECs. Data represent the mean ± SEM from n=3 experiments. (B) Summary of the effect of Fsk on ASL pH in non-CF and CF cultures. Data represent the mean ± SD from n=69 non-CF cultures and 35 CF cultures (2-way ANOVA, Sidak's multiple comparisons test). (C) Representative traces of the effect of CFTRinh172 (172, 20 µM) on the Fsk-induced increase in ASL pH in non-CF hAECs. Data represent the mean ± SEM from n=5 experiments. (D) Summary of the effect of 172 on Fsk-induced alkalinisation of the ASL in non-CF cultures. Data represent the mean ± SEM from n=5 experiments (2-way ANOVA, Sidak's multiple comparisons test).

