
Figure 2. Changes in regional cerebral blood flow related tissue radioactivity in rats during recall.
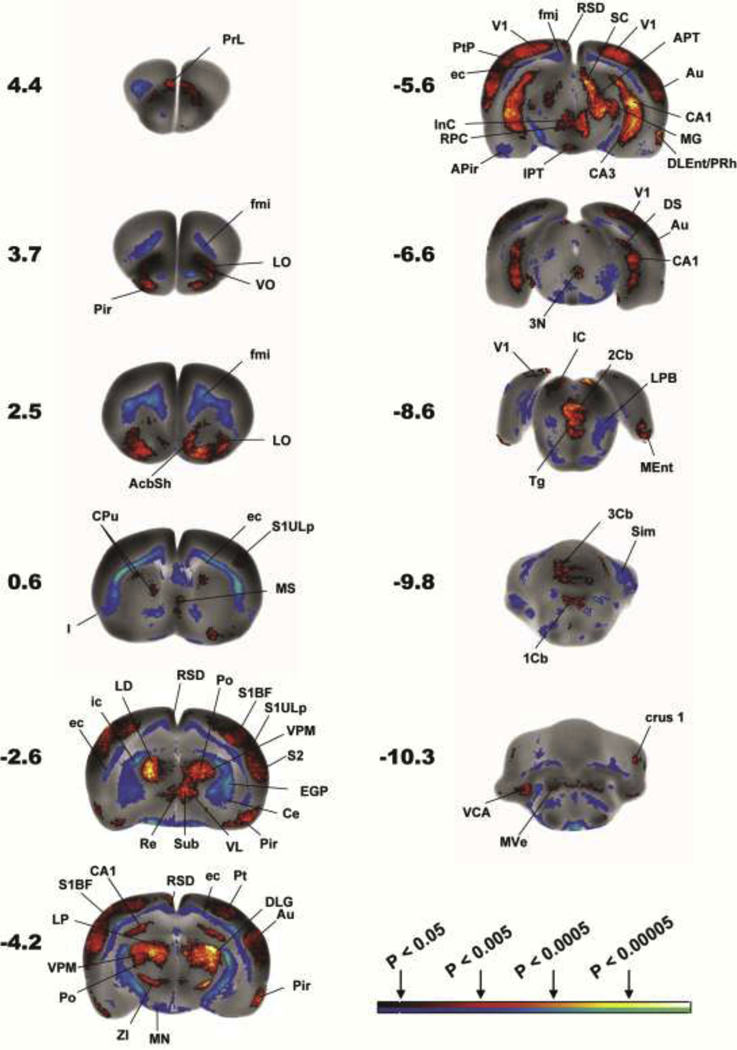
Comparison is made of functional brain activation between LEARNERS (n=11) and CONTROLS (n=8). Depicted is a selection of representative coronal slices (anterior–posterior coordinates relative to the bregma in millimeters, left side of image represent the right hemisphere). Color-coded overlays show statistically significant positive (red) and negative (blue) differences (P<0.05, >100 significant, contiguous voxels). Regions indicated are according to the Paxinos and Watson rat brain atlas [17] and abbreviations are listed in Tables 1 and 2. The color bar represents p-values (statistical differences) as determined by the statistical parametric mapping (SPM). The bilateral nature of many of the significant changes, something not accounted for in the SPM analysis, strengthens the significance of the findings.