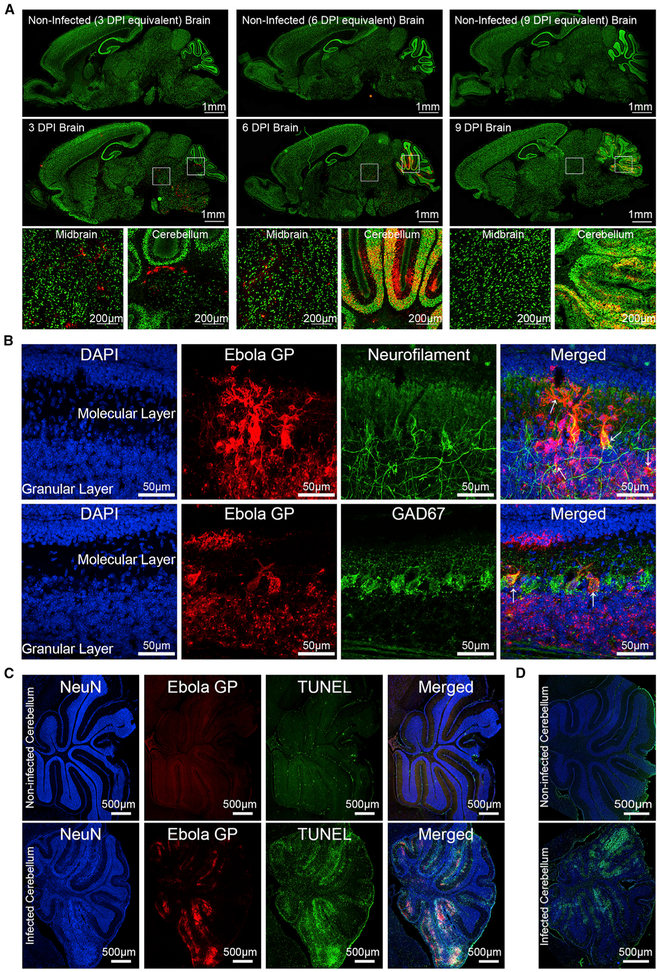
Figure 3. Neurotropic rVSVΔG-ZEBOV-GP Infection in the Brain.
C57BL/6 mice (P3) were inoculated with rVSVΔG-ZEBOV-GP, and brains were collected for IHC at 3, 6, and 9 DPI.
(A) Sagittal sections of non-infected (n = 7) and infected (n = 9) mice were stained with antibodies to Ebola GP (red) and NeuN (green); scale bars, 1 mm. Boxed areas of infected midbrain and cerebellum regions are shown below; scale bars, 200 μm.
(B) Confocal microscopy was performed on 6 DPI brain sections (n = 3) stained with DAPI (blue), Ebola GP (red), and either neurofilament (green) or GAD67 (green); scale bars, 50 μm. Right: merged images (red + blue + green). White arrows indicate infected cells.
(C) Non-infected (n = 4) and rVSVΔG-ZEBOV-GP-infected (n = 5) sections were stained with antibodies to NeuN (blue), apoptosis marker TUNEL (green), and ZEBOV GP (red) at 9 DPI. Right: merged images. Scale bars, 500 μm.
(D) Non-infected (n = 4) and rVSVΔG-ZEBOV-GP-infected (n = 9) sections were stained with Fluoro-Jade C (green), a marker for neurodegeneration, and DAPI (blue); scale bars, 500 μm. Data represent 2–4 independent experiments.

