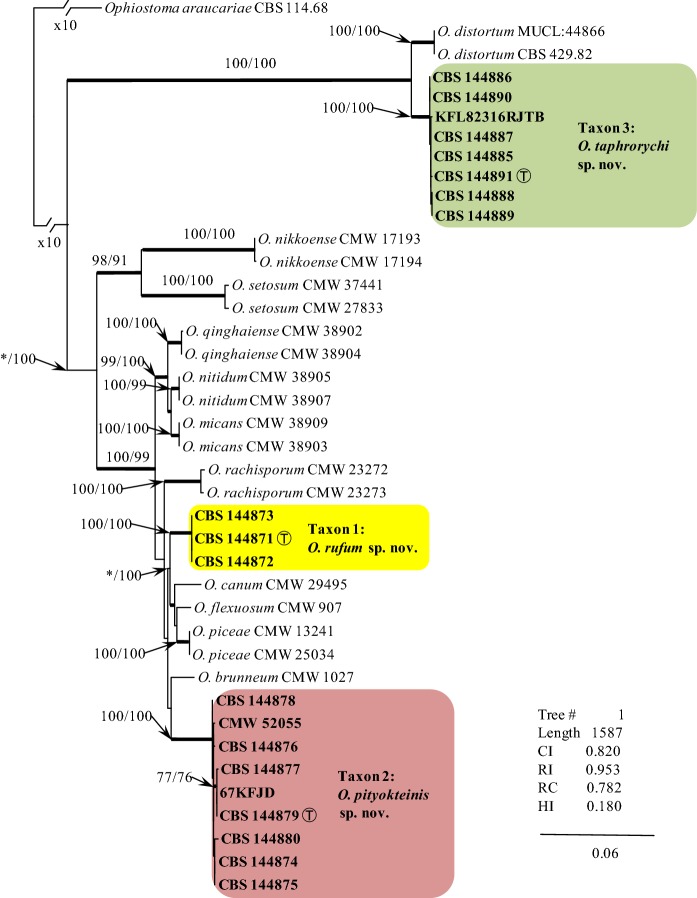
Fig. 3.
ML based tree topology for species in the Ophiostoma piceae species complex generated from the DNA sequences of the combined (concatenated) dataset including the ITS region and three protein coding gene sequences (βT, CAL, TEF1-α). Bootstrap values ≥ 75% for ML and Maximum Parsimony (MP) analyses are presented at nodes as follows: ML/MP. Bold branches indicate posterior probabilities values ≥ 0.95 as obtained from Bayesian Inference (BI) analyses. The symbol * indicates bootstrap values < 75%. The tree is drawn to scale (see bar) with branch length measured in the number of substitutions per site. Taxon 1—Ophiostoma rufum sp. nov., Taxon 2—Ophiostoma pityokteinis sp. nov., Taxon 3—Ophiostoma taphrorychi sp. nov. T—Ex-type

