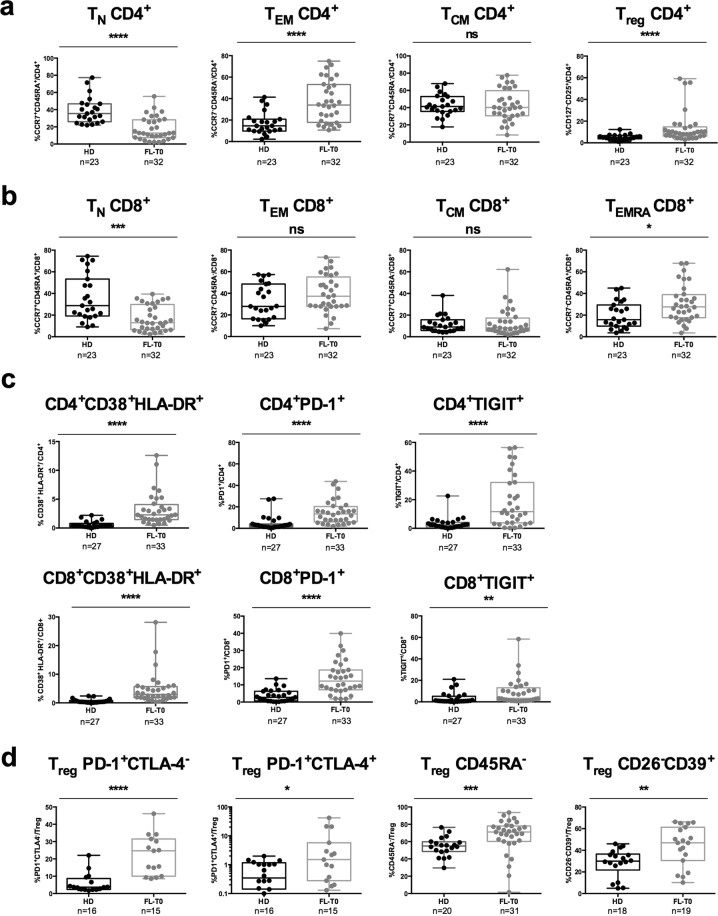
Figure 2.
Analysis of peripheral T-cell subsets in FL patients before treatment. Box-and-whisker plots of flow cytometry data obtained from healthy donors (HD) and FL patients before treatment (FL-T0) blood samples. (a) Percentages of CCR7+CD45RA+ naive (TN), CCR7−CD45RA− (TEM), CCR7+CD45RA− (TCM) and CD127−CD25+ (Treg) CD4+ T cells. (b) Percentages of TN, TEM, TCM and CCR7−CD45RA+ (TEMRA) CD8+ T cells. (c) Percentages of CD38+HLA-DR+, PD-1+ and TIGIT+ among CD4+ and CD8+ T cells. (d) Percentages of PD-1+CTLA-4−, PD-1+CTLA-4+, CD45RA− and CD26−CD39+ among Treg. The number of samples that have been successfully processed are indicated below each panel. A Mann-Whitney test was performed for statistical analyses. *p < 0.05; **p < 0.01; ***p < 0.001; ****p < 0.0001; ns: not significant.

