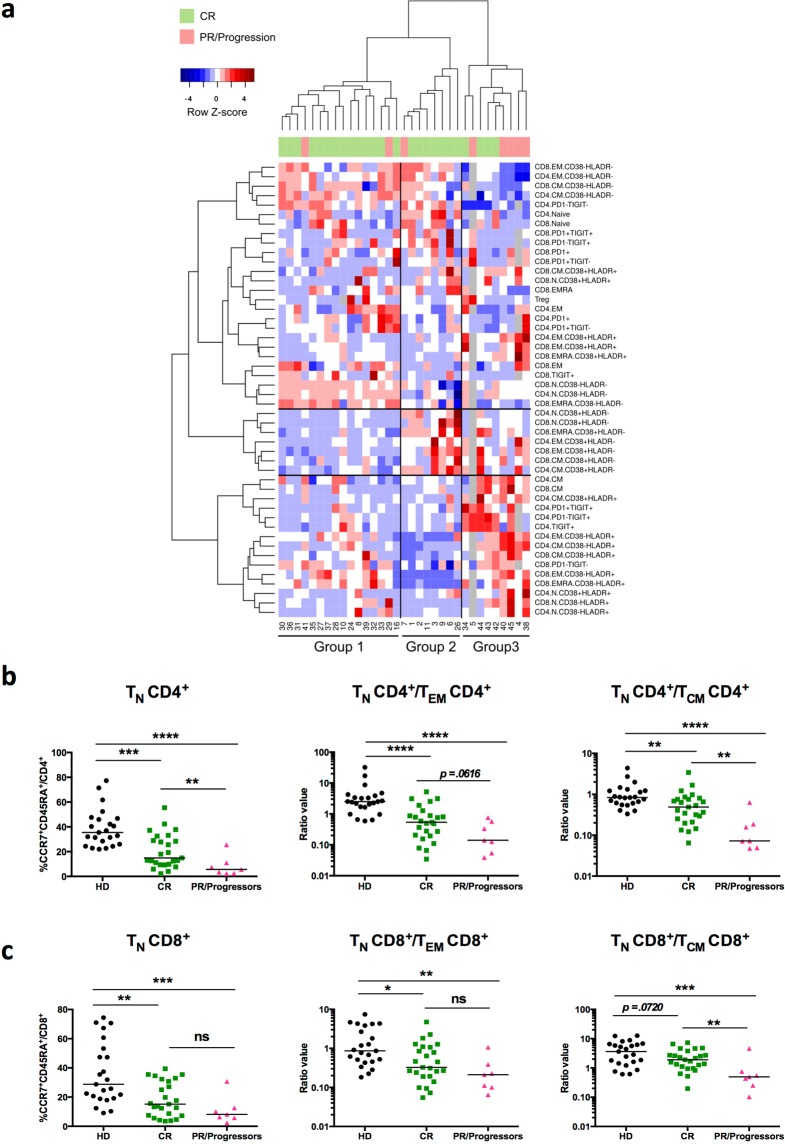
Figure 4.
Heterogeneity of peripheral T-cell profiles in FL patients before treatment. (a) Hierarchical clustering of FL patients (n = 33) based on peripheral T-cell phenotypes before treatment. Phenotypes of analyzed T-cell subsets are indicated on the right. N indicates naive, CM central memory, EM effector memory, and EMRA effector memory RA+, CD4+ or CD8+ T cells. Patient numbers are indicated below the diagram. The heatmap is colored according to row Z-scores. Some of the values are missing in three patients (grey squares). Patient response to treatment is indicated below column dendrogram. Green = complete responders (CR); pink = partial responders (PR) and progressors. (b,c) Scatter plots of flow cytometry data obtained from pre-treatment blood samples of CR patients (n = 25) or PR/progressors patients (n = 7) or healthy donors (HD, n = 23). (b) Percentages of CCR7+CD45RA+ naive (TN) cells among CD4+ T cells and ratios of CD4+ TN/TEM or TN/TCM subsets. (c) Percentages of CCR7+CD45RA+ naive (TN) among CD8+ T cells and ratios of CD8+ TN/TEM or TN/TCM subsets. A Mann-Whitney test was performed for statistical analyses. *p < 0.05; **p < 0.01; ***p < 0.001; ****p < 0.0001; ns: not significant.

