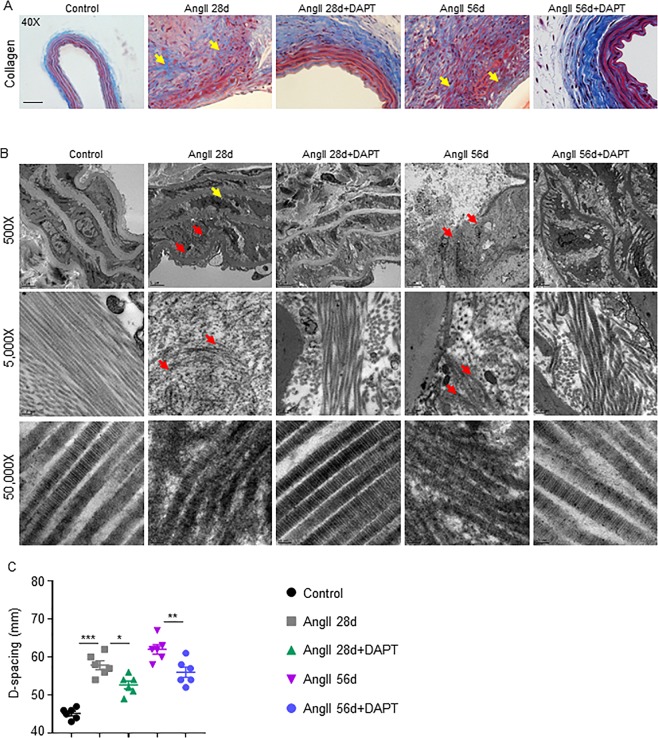
Figure 3.
Notch Inhibition minimizes collagen and ECM degradation. (A) Representative trichrome images of aorta showing collagen contents in the indicated groups. (B) Representative transmission electron microscopy (TEM) images comparing collagen bundles/fibers and D-spacing of collagen molecules. (C) Quantification of D-spacing in experimental groups as determined by TEM (n = 4). Tukey multiple comparisons test was used for data analysis in C. *P < 0.05; **P < 0.01; ***P < 0.001. Scale bar = 50 µm in A and 5 µm in top, 0.2 µm in the middle and 50 nm in the lower panel of B.

