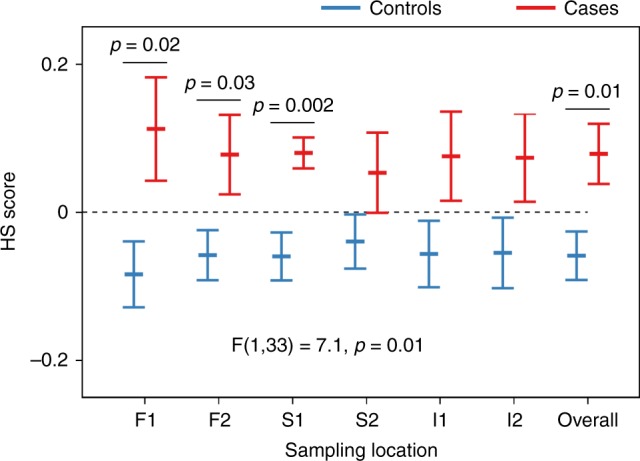
Fig. 4.

Discrimination between case and control groups using hyperspectral (HS) scores. HS scores obtained at the different sampling locations were higher for cases than for controls (F1,33 = 7.1, p = 0.01, two-way repeated measures ANOVA). Pairwise multiple comparisons (two-sided unpaired t tests controlled for false discovery rate for each comparison) show significant differences between case (n = 15) and control (n = 20) groups at sampling locations F1, F2, S1 and for the average of all retinal locations (overall). Data shown as mean ± SEM. Source data are available as a Source Data file
