Fig. 7.
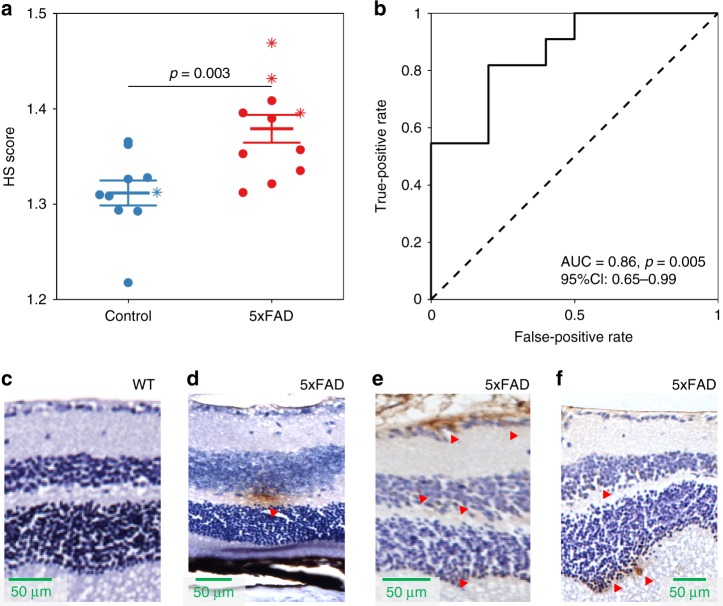
5xFAD retinal HS imaging validates human findings. Mouse retinal hyperspectral (HS) scores were calculated using the recalibrated human spectral model (450–680 nm). a HS scores were significantly different for control (blue, n = 10) and 5xFAD mice (red, n = 11; mean ± SEM). The markers (*) denote HS scores of mice that were selected for retinal Aβ immunohistochemistry c–f. b Receiver operating characteristic curve (ROC) and area under the curve (AUC) showed good discrimination between control and 5xFAD mice. c–f Immunohistochemistry of 5xFAD retina using human Aβ-specific 1E8 antibodies. c shows a wild-type (WT) mouse. d–f show representative 5xFAD mouse retinas (age 9–14 months). Brown regions denoted by red arrows mark regions of Aβ immunoreactivity. Source data are available as a Source Data file

