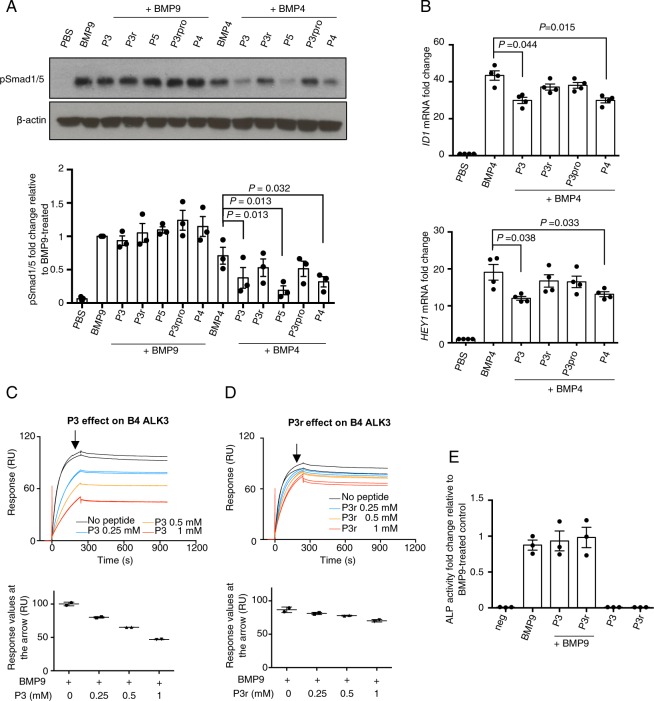
Figure 4.
The effect of peptide P3 is BMP and cell type-dependent. (A) Representative pSmad1/5 immunoblot of protein extracts from HMEC-1 treated with peptide P3, P3r, P3rpro P4 and P5 (at 250 μM) with or without BMP9 (at 0.03 ng/ml, or 1.24 pM GFD dimer) or BMP4 (at 0.3 ng/ml, or 11.54 pM GFD dimer). Quantification of pSmad1/5 from three independent experiment is shown below. N = 3. Data shown as means ± S.E. In the BMP4-treated group, paired t-tests against BMP4-treated control were performed, and those with P values < 0.05 are shown. (B) Effect of peptide P3 and control peptides (at 160 μM) on BMP4 (3 ng/ml, or 115.4 pM GFD dimer) stimulated gene induction of ID1 and HEY1 in HMEC-1, N = 4. Data shown as means ± S.E., paired t-tests against BMP4-treated control, and those with P values < 0.05 are shown. (C,D) SPR sensorgrams of BMP4 binding to ALK3-Fc in the presence of peptide P3 (C) or P3r (D) at various concentrations on an ALK3-Fc coated CM5 chip. Plots of the maximum binding levels (indicated by the arrows) against peptide concentrations are shown below each graph respectively. (E) Effect of peptide P3 and control peptides (at 160 μM) on BMP9-induced ALP activity in C2C12 cells. Data were obtained from three independent experiments, with duplicated wells for each treatment condition in a single experiment. Data shown as means ± S.E.

