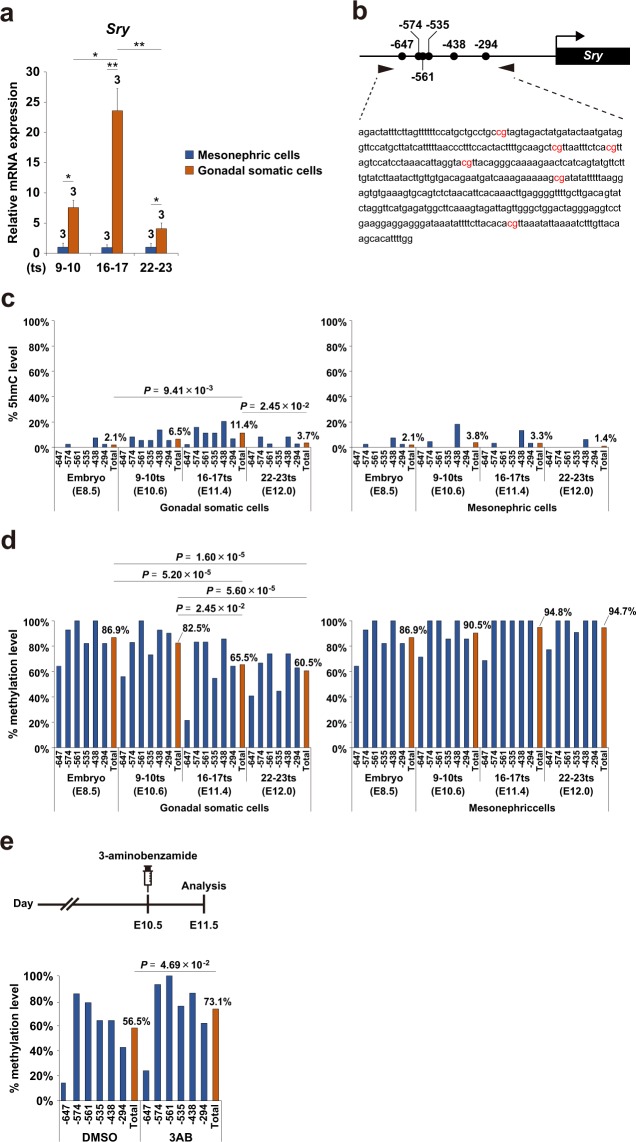
Figure 2.
Sry promoter undergoes active DNA demethylation during gonadal development. (a) qRT-PCR analysis of Sry in XY mesonephric cells and gonadal somatic cells at the indicated ts stages. mRNA expression levels in mesonephric cells at the 9–10 ts stage (E10.6) were defined as 1. Data are presented as mean ± SD. *P < 0.05, **P < 0.01. n = 3. (b) Schematic representation of Sry promoter. Sry promoter contains 6 CpG sites. The positions of CpG sites are indicated relative to the start codon. (c and d) DNA methylation kinetics on Sry promoter in XY E8.5 embryos and XY mesonephric/gonadal somatic cells at the indicated developmental stages by Tet-assisted bisulfite sequencing analysis (c) and bisulfite sequencing analysis (d). Blue bars show the average percentage of methylation at individual CpG sites respectively and the red bar indicates that on total CpG sites. P values for bisulfite sequencing were obtained using the non-parametric two-tailed Mann-Whitney U test. (e) Administration of BER inhibitor inhibits DNA demethylation in the Sry promoter in developing gonads. The experimental scheme is shown in the upper panel. A BER inhibitor 3-aminobenzamide (3-AB) was intraperitoneally injected into pregnant females carrying E10.5 embryos. At 24 hours after injection, gonadal somatic cells were purified from XY embryos and used for bisulfite sequencing analysis. The lower panel shows DNA methylation levels of Sry promoter in 3-AB-treated and DMSO-treated (as vehicle control) XY gonadal somatic cells. The blue bar shows the average percentage of methylation at individual CpG sites and the red bar shows that of total CpG sites. P values for bisulfite sequencing were obtained using the non-parametric two-tailed Mann-Whitney U test.

