
Fig. 2.
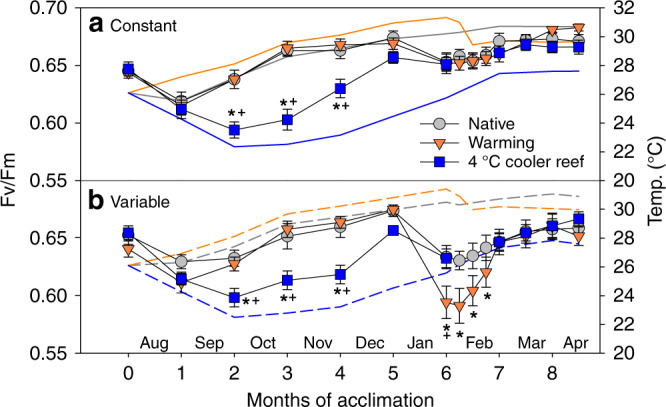
Photochemical efficiency (Fv/Fm) during the acclimation phase. Acropora aspera corals were maintained under a constant daily temperatures or b 4 °C daily temperature variability. Solid and dashed lines represent monthly tank temperatures for each treatment (Table S2). Mean ± 1 S.E.M. is shown. Asterisks indicate a significant difference from the native (control) treatment, whereas plus (+) indicates a significant difference between the warming and 4 °C cooler reef treatments (p < 0.05; Tukey post hoc tests). Note that 4 °C cooler reef corals were not measured weekly between months 6 and 7. Source data are provided as a Source Data file