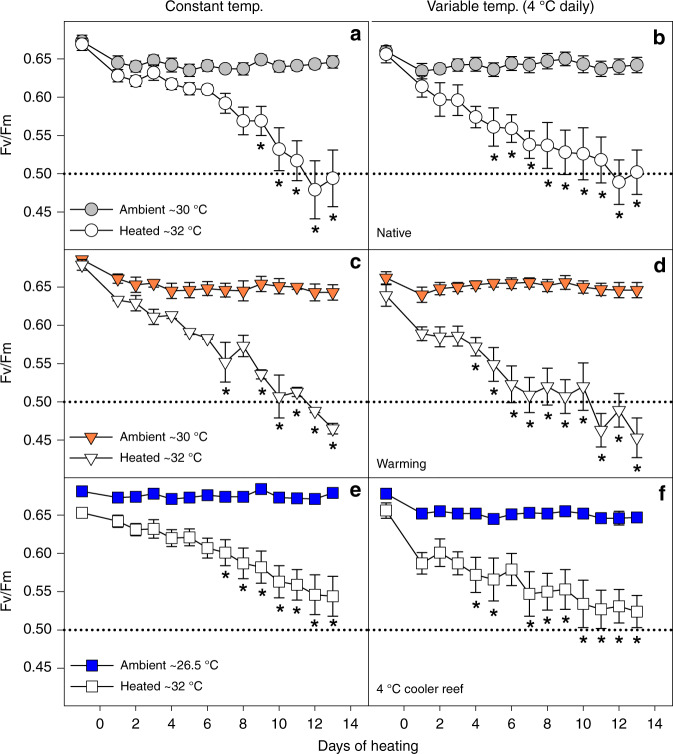
Fig. 5.
Photochemical efficiency (Fv/Fm) during the heat stress test. Acropora aspera corals were maintained under a, c, e constant daily temperatures or b, d, f 4 °C daily temperature variability. The heat stress test followed long-term exposure to three different temperature regimes (native control = circles, warming = triangles, 4 °C cooler reef = squares). Mean ± 1 S.E.M. is shown. Asterisks indicate a significant difference between ambient and heat-stressed corals at each temperature and variability regime (p < 0.05; Tukey post hoc tests). The dotted lines were added to highlight differences between treatments. Note that the first time point corresponds to the start of the temperature ramp up (mid-April), approximately 1 month prior to the start of the heat stress test (17 May). Source data are provided as a Source Data file

