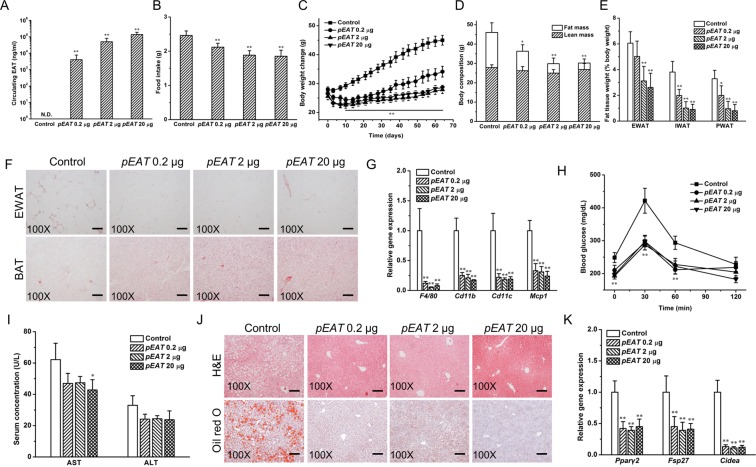
Figure 2.
EAT gene transfer blocks HFD-induced weight gain, hyperadiposity, macrophage activation, fatty liver development and improves glucose homeostasis. (A) Blood levels of EAT protein at 9 weeks after pEAT injection. (B) EAT gene transfer reduced daily HFD intake of each mouse. (C) EAT gene transfer repressed HFD-induced weight gain. (D) EAT gene transfer reduced fat mass while showing no significant impact on lean mass. (E) EAT gene transfer reduced the weights of white fat depots. EWAT, epididymal white adipose tissue; IWAT, inguinal white adipose tissue; PWAT, perirenal white adipose tissue. (F) Representative images of H&E staining of EWAT and BAT; Scale bar = 50 μm. (G) Relative mRNA levels of key genes responsible for chronic inflammation in EWAT. (H) Profiles of blood glucose concentration as function of time upon intraperitoneal injection of glucose. (I) Blood levels of AST and ALT. (J) Representative images of H&E staining and Oil red O staining of the liver sections; Scale bar = 50 μm. (K) Relative mRNA levels of key genes responsible for lipogenesis in the liver. Values in (A–E), (G–I), and (K) represent average ± SD (n = 5). *P < 0.05 compared with the control, **P < 0.01 compared with the control.

