Figure 3.
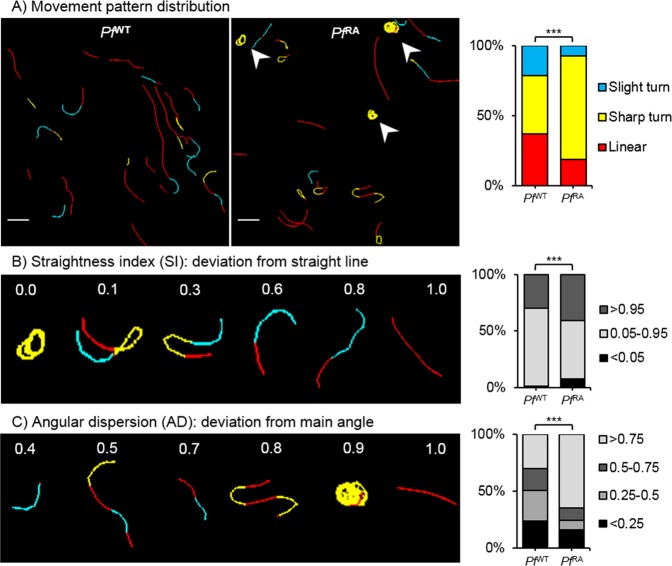
Tortuosity of sporozoite tracks. (A) Two examples of movement pattern maps of tracked sporozoites; Pf WT in skin (left) and Pf RA in skin (middle). Linear segments are depicted in red, slight turns in blue and sharp turns in yellow. Arrowheads indicate circular sporozoite tracks comparable to in vitro movement. The movement pattern distribution of the Pf WT and Pf RA is quantified for all sporozoite tracks based on frames (right). Scale bar: 20 µm. (B) To illustrate the concept of straightness index (SI) in relation to sporozoite tracks, 6 tracks are displayed out of the movement pattern maps shown in A. The SI distribution is quantified based on the SI values of total tracks (Pf WT median: 0.89, IQR: 0.66–0.96; Pf RA median: 0.90, IQR: 0.46–0.98). (C) To illustrate the concept of angular dispersion (AD) in relation to sporozoite tracks, 6 tracks are displayed out of the movement pattern maps shown in A. The AD distribution is quantified based on the AD values of total tracks (Pf WT median: 0.47, IQR: 0.26–0.80; Pf RA median: 0.93, IQR: 0.51–0.99). ***p < 0.0001 using Chi squared test.

