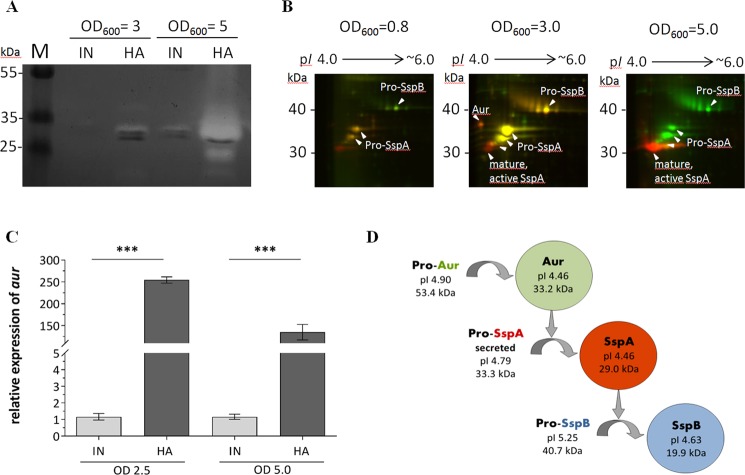
Figure 3.
Proteolytic activity. (A) Casein gel zymography. SDS-PAGE supplemented with 1% casein as a substrate, where a white band is representative for casein digestion. (B) Representative dual-channel gel images of the secretomes of initial (green channel) and host-adapted (red channel) isolate at different OD readings. Differentially abundant proteins were identified by MALDI-TOF-MS/MS (see Fig. S4) (C) aur expression of strains grown in TSB to an optical density of 2.5 and 5.0. The data shown are the means of three independently grown strains and their technical duplicates. Statistical difference between the expression of the initial and host-adapted isolate was determined with unpaired Students t test. (***P < 0.001) (D) Proteolytic cascade cartoon, including the proteins’ molecular weight (MW) and isoelectric point (pI), adapted from Shaw et al.33. Original, full length zymogel/ 2D-DIGE gels are shown in the Supplementary Information Fig. S7. IN, initial isolate; HA, host-adapted isolate; SspA, glutamyl endopeptidase; SspB, staphopain B; Aur, zinc metalloprotease aureolysin.

